Unlock a world of possibilities! Login now and discover the exclusive benefits awaiting you.
- Qlik Community
- :
- Forums
- :
- Groups
- :
- Industry and Topics
- :
- Monitoring & Administration
- :
- Monitoring your Qlik Sense Enterprise / Qlik Analy...
- Subscribe to RSS Feed
- Mark Topic as New
- Mark Topic as Read
- Float this Topic for Current User
- Bookmark
- Subscribe
- Mute
- Printer Friendly Page
- Feature this Topic
- Mark as New
- Bookmark
- Subscribe
- Mute
- Subscribe to RSS Feed
- Permalink
- Report Inappropriate Content
Monitoring your Qlik Sense Enterprise / Qlik Analytics Platform using Zabbix
About Zabbix
Zabbix (www.zabbix.com) has been widely used around the globe as a monitoring platform.
It's open-source, it scales well, has templates for monitoring a lot of environments and obviously can be used to monitor Qlik Sense/QAP sites.
There are two approaches, one using a Windows Server agent another one full agentless. For this doc, I will be using the agentless approach
HealthCheck
Let's check how to monitor a Qlik Sense Enterprise without installing anything in the Windows box.
There is one special endpoint in every proxy server in the Qlik Sense site (documentation is here). This endpoint returns some statistics about your engine health and they are encoded using JSON.
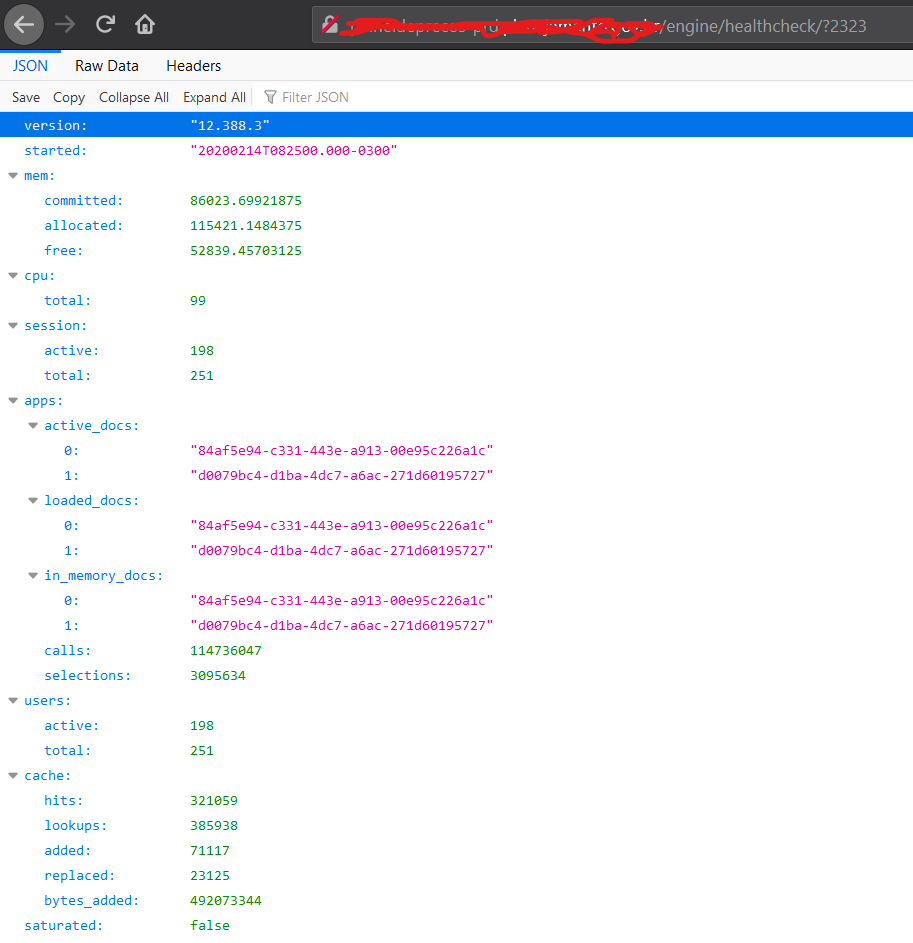
In our example, let's use mem.free, cpu.total, session.total, saturated
Configuring the Host
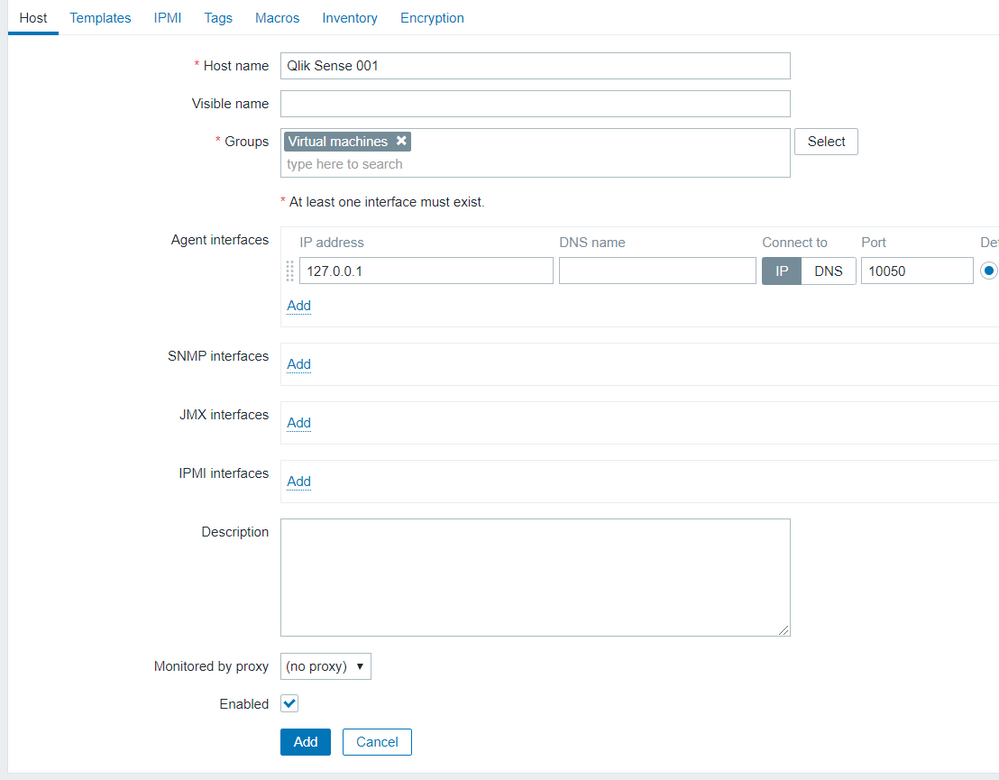
First of all, we need to create a "host" in the Zabbix configuration (help), a host represents a machine and then we can add items (each statistic being retrieved).
Go to Configuration/Hosts and we will see a "Create Button" on top right position.
As we are using one agentless approach, we only have to inform the hostname and choose a group (any group we need or maybe we'd rather use a "Qlik Sense" group then press "Add"
Configuring the Items
Now we need to collect the statistics (items).
As we are retrieving four values, it will be more efficient to retrieve the full JSON response and then parse the JSON instead of calling the endpoint four times every time.
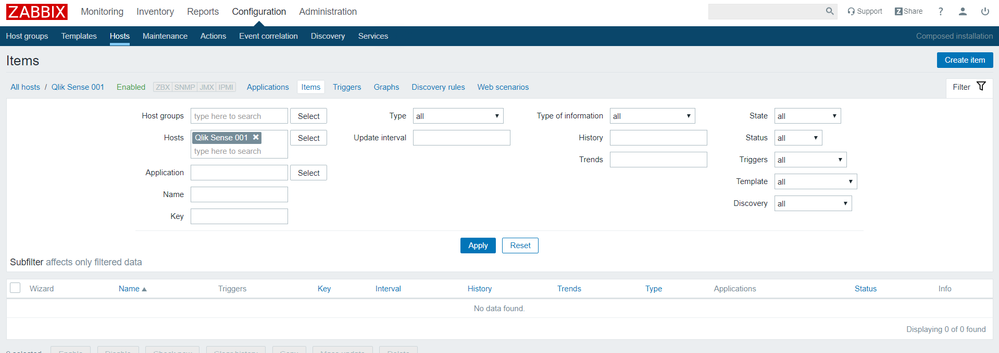
In the host list, choose our host and click in Items, and then press "Create Item" (top right of our screen)
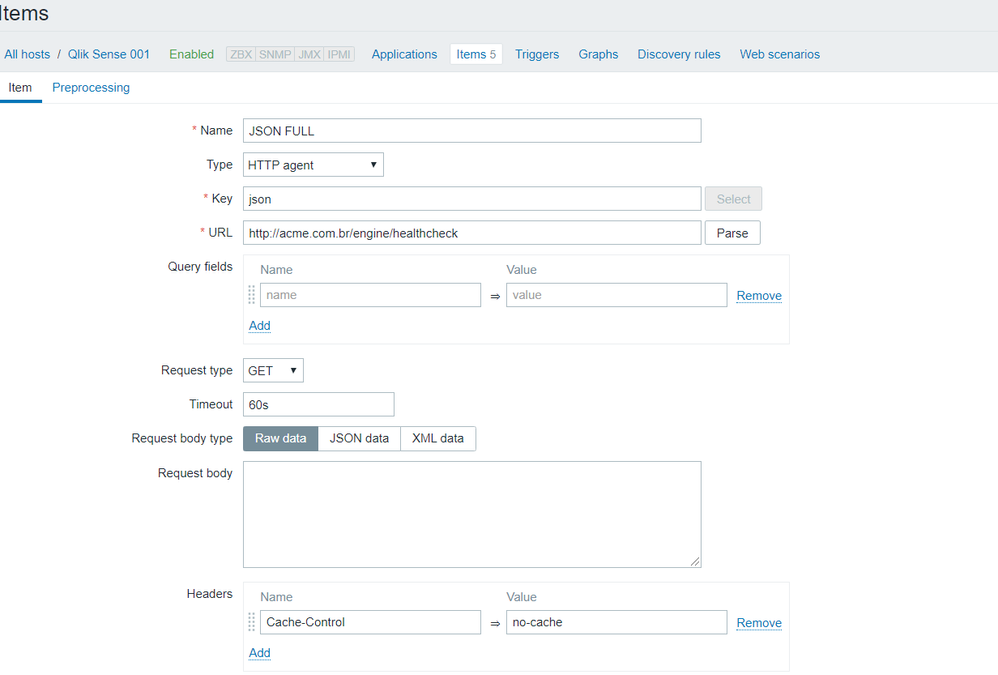
As we don't have an agent running in the host, we will use one "HTTP Agent" that can make http requests.
Please use these values to create our item that will hold the JSON response
| Name | JSON FULL (for example) |
| Type | HTTP Agent |
| key | json (for example) |
| URL | http://[server]/engine/healthcheck |
| Request Type | GET |
| Headers | Add one header with Cache-Control = no-cache this prevents our engine or any proxy to retrieve same values across requests |
| Authentication | <Same as our Virtual Proxy> |
| Update Interval | 3m (or another value) Please don't push too hard 🙂 |
(If you are an experienced Zabbix admin you can play with other parameters)
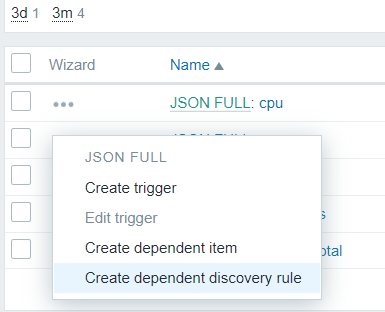
Now we will create one "dependent item" for each statistic that we want to retrieve from the JSON response.
Let's create one dependent item named "cpu"
Please fill these values
| Name | cpu |
| Type | Dependent Item |
| Key | cpu |
| Master Item | select your JSON FULL item |
| Type of information | Numeric (unsigned) |
You will see one option "Preprocessing", please use it to access this screen
We are using one step called "JSONPath" that can parse one JSON string (it's beyond the scope of this doc explain JSONPath).
To retrieve the cpu total value, use $.cpu.total and then press "Add"
Please repeat the steps for mem.free, cpu.total, session.total, saturated (use text as "Type of Information" for this one)
Now we are ready, all the items are being collected.
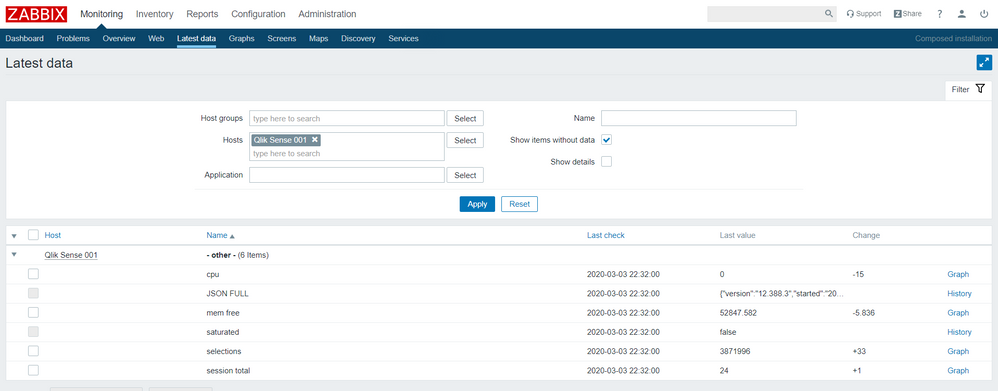
Wait some minutes and go to "Monitoring/Latest Data", select your host and see that the values are being retrieved and Zabbix is generating graphs with your item values.
For example, this graph is about cpu usage last 15 min
Other steps (please refer to Zabbix documentation to learn how to implement)
- Attach a trigger to an item value, so you can be notified (e-mail for example) when your QSE is "saturated =true"
- Install Zabbix agent, so you can collect more information (%Disk free) for example
- Create a "Graph", merging two or more statistics in the same graph
- Import data from Zabbix in your Qlik Sense, so you can use the most powerful data analytics platform in the market
Keep Qlikking
- Tags:
- Group_Documents
- Mark as New
- Bookmark
- Subscribe
- Mute
- Subscribe to RSS Feed
- Permalink
- Report Inappropriate Content
Thanks @Clever_Anjos , great post!
One question: is the no-cache parameter also needed on a Virtual Proxy level? As explained in this article: https://support.qlik.com/articles/000082982
Many thanks,
Riccardo
- Mark as New
- Bookmark
- Subscribe
- Mute
- Subscribe to RSS Feed
- Permalink
- Report Inappropriate Content
Hi, great question!
If you set this in Zabbix I almost sure that you don't need to change your virtual proxy.
I'm monitoring a QAP with VP untouched and Zabbix is getting new values using no-cache from the item
