Unlock a world of possibilities! Login now and discover the exclusive benefits awaiting you.
- Qlik Community
- :
- Forums
- :
- Analytics
- :
- New to Qlik Analytics
- :
- Bank Performance Dashboard
- Subscribe to RSS Feed
- Mark Topic as New
- Mark Topic as Read
- Float this Topic for Current User
- Bookmark
- Subscribe
- Mute
- Printer Friendly Page
- Mark as New
- Bookmark
- Subscribe
- Mute
- Subscribe to RSS Feed
- Permalink
- Report Inappropriate Content
Bank Performance Dashboard
Hi Friends,
I need a help.
I want to find out the particular bank performance or contribution in india.
Example:
Money Sending Country Name Money Receiving Country Name Bank Name Total Amount
Global India SBI 1000
Global India ICICI 2000
Global India IDBI 3000
Global India HDFC 4000
Global India HSBC 5000
above table shows globally money received from india's different banks.
I want to find out the contributions of ICICI bank india.
Total Amount received to india 15000
contribution of ICICI 2000 13%
rest of the bank contribution 13000 87%
I want to present these performance for using pie chart.
I want the expression for this calculation in qlik sense.
friends kindly share the expression for above calculation.
Accepted Solutions
- Mark as New
- Bookmark
- Subscribe
- Mute
- Subscribe to RSS Feed
- Permalink
- Report Inappropriate Content
- Mark as New
- Bookmark
- Subscribe
- Mute
- Subscribe to RSS Feed
- Permalink
- Report Inappropriate Content
Is ICICI Bank fix dimension or you want list box for Banks?
- Mark as New
- Bookmark
- Subscribe
- Mute
- Subscribe to RSS Feed
- Permalink
- Report Inappropriate Content
Just use a pie chart
As dimension bank
As measure sum(amount)
- Mark as New
- Bookmark
- Subscribe
- Mute
- Subscribe to RSS Feed
- Permalink
- Report Inappropriate Content
Dear Pankaj,
I have more than 150 bank list are there.
when select the particular bank like icici in the list box the pie chart should be the contributions of icici and rest of banks contribution.
Pie chart:

Raw Data:
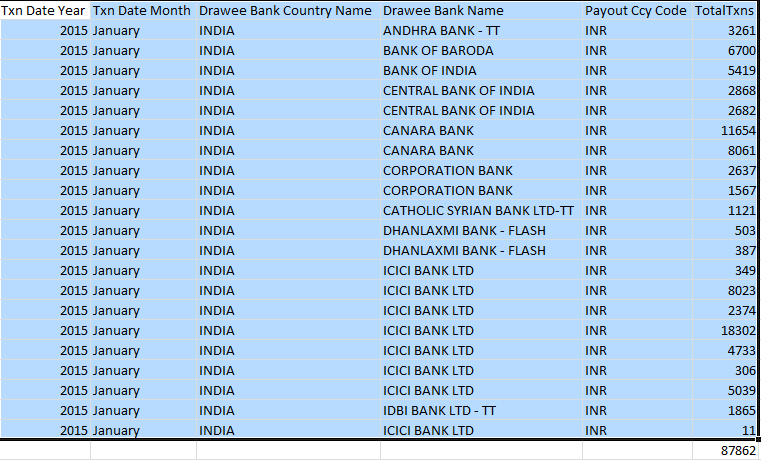
Total Txn happened in india is 87862
contribution of icici 39317
rest of banks in india 48545
I need the expression for above calculation.
when I select the other bank answer should be like % of contribution and % of rest of bank contribution.

- Mark as New
- Bookmark
- Subscribe
- Mute
- Subscribe to RSS Feed
- Permalink
- Report Inappropriate Content
Dear Omar,
please find the attachment for your reference.
calculation:
| icici total txn | 369,914 | |
| txn happened in india | 1,462,534 | |
| contribution of icici | 369,914 | 25% |
| rest of india or other bank | 1,092,620 | 75% |
when I select the particular bank in list box the answer should be the above calculation for all other bank.
I want to project both contribution (particular bank % and rest of banks total %)

- Mark as New
- Bookmark
- Subscribe
- Mute
- Subscribe to RSS Feed
- Permalink
- Report Inappropriate Content
Dear Omar ,
Any update on this expression ?
this is an urgent requirement so please help me.
- Mark as New
- Bookmark
- Subscribe
- Mute
- Subscribe to RSS Feed
- Permalink
- Report Inappropriate Content
Hi
I hope it´s no too late.
Here is my suggestion.
Good luck
- Mark as New
- Bookmark
- Subscribe
- Mute
- Subscribe to RSS Feed
- Permalink
- Report Inappropriate Content
Please find attached QVF .