Unlock a world of possibilities! Login now and discover the exclusive benefits awaiting you.
- Qlik Community
- :
- Forums
- :
- Analytics
- :
- New to Qlik Analytics
- :
- Re: Bar graph
- Subscribe to RSS Feed
- Mark Topic as New
- Mark Topic as Read
- Float this Topic for Current User
- Bookmark
- Subscribe
- Mute
- Printer Friendly Page
- Mark as New
- Bookmark
- Subscribe
- Mute
- Subscribe to RSS Feed
- Permalink
- Report Inappropriate Content
Bar graph
Hello!!!
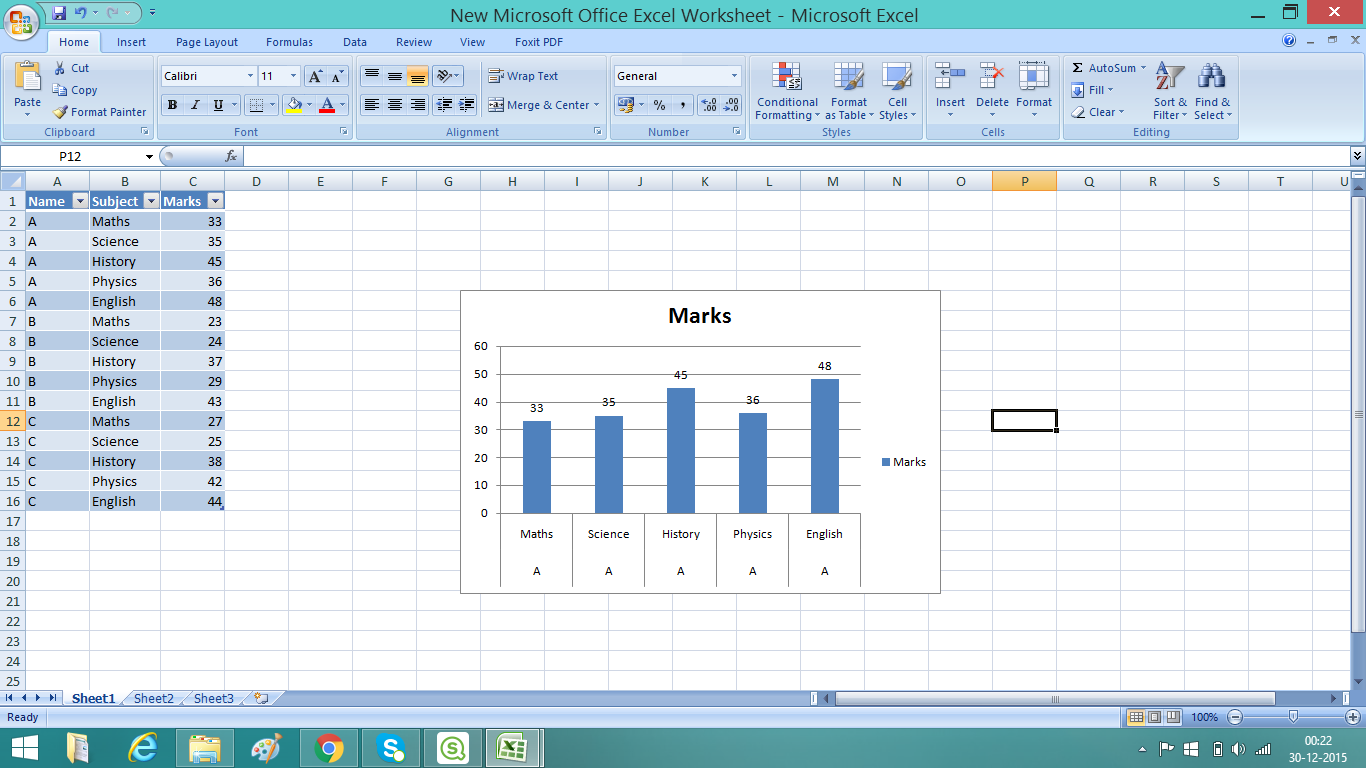
I need a help with a bar graph. I want to plot a graph with variable "subjects" in dimension and student's marks as a measure. And I want to show that if I select a particular student, I get a bar graph showing his marks in all the subjects. The below image depicts what I want with students name in filter.
- Mark as New
- Bookmark
- Subscribe
- Mute
- Subscribe to RSS Feed
- Permalink
- Report Inappropriate Content
wHat help do you actually need the requirement seems straight forward
- Mark as New
- Bookmark
- Subscribe
- Mute
- Subscribe to RSS Feed
- Permalink
- Report Inappropriate Content
Hi Rupali,
This works the same as i posted in the other thread.
There is no group option as such in QlikSense. But you can achieve this using an extension and pick() function.
Create an extension(Toggle buttons or a single button based on your requirement) which toggles through the numbers 1 to 4 and this extension should update a variable (vPick) with the number.(Assuming that there are only 4 dimension to go around)
now use this as your dimension in a bar chart.
pick($(vPick),[Dim1],[Dim2],[Dim3],[Dim4])
If this is a must have requirement, let me know and I will help you build an extension for you.
Thanks,
Sangram Reddy.
- Mark as New
- Bookmark
- Subscribe
- Mute
- Subscribe to RSS Feed
- Permalink
- Report Inappropriate Content
Hi Rupali,
So what you need here is a drill down dimension and not a group.
So As you wanted: When you select a student it should drill down to his respective subjects. Right?
If thats the case, Create a master dimension in QlikSense which is a drill down.
Check the QVF which I have attached.
Thanks,
Sangram.
- Mark as New
- Bookmark
- Subscribe
- Mute
- Subscribe to RSS Feed
- Permalink
- Report Inappropriate Content
To merge these charts into one view try implementing this which mimics the cyclical functionality allowing you to have different context within the same chart. Uses existing extensions.
- Mark as New
- Bookmark
- Subscribe
- Mute
- Subscribe to RSS Feed
- Permalink
- Report Inappropriate Content
Yeah It works!!! Thank you for your help 
- Mark as New
- Bookmark
- Subscribe
- Mute
- Subscribe to RSS Feed
- Permalink
- Report Inappropriate Content
Thank You Mr. Andy Weir for your help
- Mark as New
- Bookmark
- Subscribe
- Mute
- Subscribe to RSS Feed
- Permalink
- Report Inappropriate Content
You are always Welcome!