Unlock a world of possibilities! Login now and discover the exclusive benefits awaiting you.
- Qlik Community
- :
- Forums
- :
- Analytics
- :
- New to Qlik Analytics
- :
- Re: Basic help with fractile function
- Subscribe to RSS Feed
- Mark Topic as New
- Mark Topic as Read
- Float this Topic for Current User
- Bookmark
- Subscribe
- Mute
- Printer Friendly Page
- Mark as New
- Bookmark
- Subscribe
- Mute
- Subscribe to RSS Feed
- Permalink
- Report Inappropriate Content
Basic help with fractile function
Hi Friends,
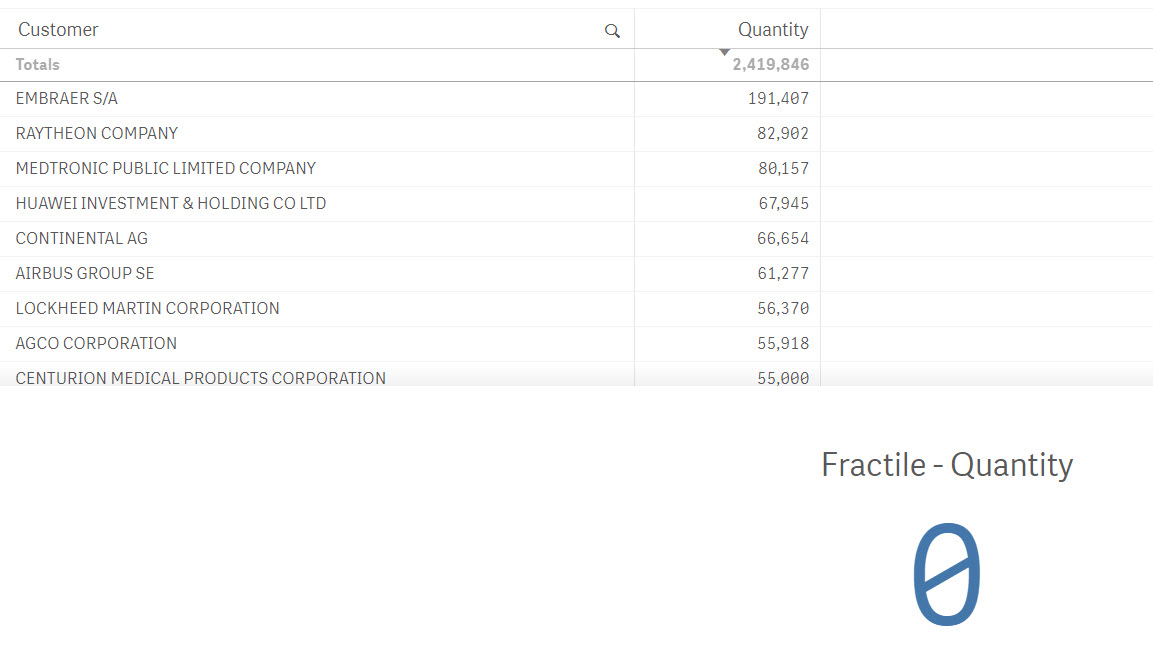
Need some help with the fractile function in Qlik sense. I am trying to explore this function to implement the decile functionality that I am looking for. I have customer with Product Quantity. I want to create 10 equal distributions based on this Product quantity.
I say "Fractile(TOTAL Quantity, 0.10)". It gives me back 0.
Any help would be appreciated?
Thanks!
- « Previous Replies
-
- 1
- 2
- Next Replies »
- Mark as New
- Bookmark
- Subscribe
- Mute
- Subscribe to RSS Feed
- Permalink
- Report Inappropriate Content
Where exactly are you using the expression?
And how do your data look like? Could you post some sample records?
- Mark as New
- Bookmark
- Subscribe
- Mute
- Subscribe to RSS Feed
- Permalink
- Report Inappropriate Content
Guessing a bit as to your precise needs, but maybe the Class() function could be more useful, here is the Help url for it.
- Mark as New
- Bookmark
- Subscribe
- Mute
- Subscribe to RSS Feed
- Permalink
- Report Inappropriate Content

- Mark as New
- Bookmark
- Subscribe
- Mute
- Subscribe to RSS Feed
- Permalink
- Report Inappropriate Content
I need something like - the list of customer names falling under 90 - 100 % decile, 80 - 90 % etc.
Cust A - 90 - 100% or 1st decile
Cust B - 90 - 100% or 1st decile
Cust C - 80 - 90% or 2nd decile
- Mark as New
- Bookmark
- Subscribe
- Mute
- Subscribe to RSS Feed
- Permalink
- Report Inappropriate Content
Your Quantity column is an expression like Sum(FIELD), right?
- Mark as New
- Bookmark
- Subscribe
- Mute
- Subscribe to RSS Feed
- Permalink
- Report Inappropriate Content
That is correct
- Mark as New
- Bookmark
- Subscribe
- Mute
- Subscribe to RSS Feed
- Permalink
- Report Inappropriate Content
You would need to create a synthetic table with dimension Customer and your Quantity expression and then apply the fractile function on top of it, assuming Sum(FIELD) as your Quantity expression and Customer field as your grouping entity:
=Fractile( Aggr( Sum(Quantity), Customer), 0.1)
- Mark as New
- Bookmark
- Subscribe
- Mute
- Subscribe to RSS Feed
- Permalink
- Report Inappropriate Content
Not sure if I did the calculation right, but this is my output.. Not really working the way I wanted

- Mark as New
- Bookmark
- Subscribe
- Mute
- Subscribe to RSS Feed
- Permalink
- Report Inappropriate Content
In the chart, you might need to use TOTAL Qualifier
Fractile(TOTAL Aggr(Sum(Count), SHIPTO_CUSTOMER_GROUP_NAME), 0.1)
- « Previous Replies
-
- 1
- 2
- Next Replies »