Unlock a world of possibilities! Login now and discover the exclusive benefits awaiting you.
- Qlik Community
- :
- Forums
- :
- Analytics
- :
- New to Qlik Analytics
- :
- Re: Calculate a new dimension based on a measure
- Subscribe to RSS Feed
- Mark Topic as New
- Mark Topic as Read
- Float this Topic for Current User
- Bookmark
- Subscribe
- Mute
- Printer Friendly Page
- Mark as New
- Bookmark
- Subscribe
- Mute
- Subscribe to RSS Feed
- Permalink
- Report Inappropriate Content
Calculate a new dimension based on a measure
Hi All,
I am not able to reproduce one analysis in Qlik, someone could help me? I attach a file with some example data.
My objective is to create the following table:
| product | < 2000 | < 4000 |
| A | 93% | 80% |
| B | 80% | 75% |
| C | 70% | 93% |
I basically have my fact table that have the following fields: Product, Data, Sale price, Margin. As my product have not always the same price I would like to make the average margin based on those product that ordered by Date has the sum of sales <2000 and after <4000.
Attached the excel file with Test Data and the result sheet, that is what I want to reproduce in qlik sense.
Ideally I just have to make a pivot table with product, those calculate dimensions and Margin as measure.
Any help would be appreciated,
Giulio
- Tags:
- custom dimension
- tabe
- « Previous Replies
-
- 1
- 2
- Next Replies »
Accepted Solutions
- Mark as New
- Bookmark
- Subscribe
- Mute
- Subscribe to RSS Feed
- Permalink
- Report Inappropriate Content
Something along these lines?
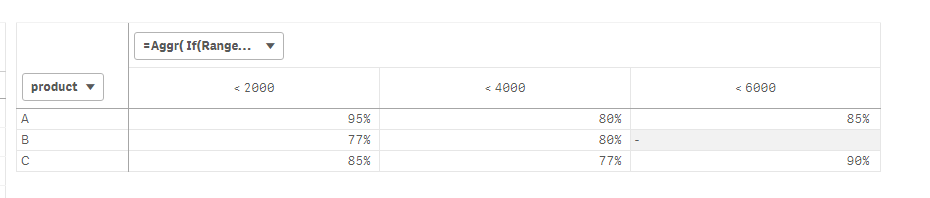
Dimension
product
Aggr(
If(RangeSum(Above(Sum([Sales price]), 0, RowNo())) < 2000, Dual('< 2000', 1),
If(RangeSum(Above(Sum([Sales price]), 0, RowNo())) < 4000, Dual('< 4000', 2),
If(RangeSum(Above(Sum([Sales price]), 0, RowNo())) < 6000, Dual('< 6000', 3),
If(RangeSum(Above(Sum([Sales price]), 0, RowNo())) < 8000, Dual('< 8000', 4),
If(RangeSum(Above(Sum([Sales price]), 0, RowNo())) < 10000, Dual('< 10000', 5)))))), product, (date,(NUMERICA, DESC)))
Expression
Avg([Margin %])
- Mark as New
- Bookmark
- Subscribe
- Mute
- Subscribe to RSS Feed
- Permalink
- Report Inappropriate Content
You averaged everything after reaching more than 2000 for product A? Since the condition is <4000, doesn't it needs to stop D7? instead of D8?
- Mark as New
- Bookmark
- Subscribe
- Mute
- Subscribe to RSS Feed
- Permalink
- Report Inappropriate Content
you are right sorry Sunny, so in this case, for product A, the margin for D8 should go in another cluster <6000. The same also for product C I am going to modify the file.
Thank you again.
- Mark as New
- Bookmark
- Subscribe
- Mute
- Subscribe to RSS Feed
- Permalink
- Report Inappropriate Content
Hi Giulio,
Is this what you were after?
- Mark as New
- Bookmark
- Subscribe
- Mute
- Subscribe to RSS Feed
- Permalink
- Report Inappropriate Content
How many clusters are there or is this something that will be dynamic? Also, these clusters, do you imagine them created in the script or on the front end?
- Mark as New
- Bookmark
- Subscribe
- Mute
- Subscribe to RSS Feed
- Permalink
- Report Inappropriate Content
The cluster will be static like 2000 - 4000 - 6000 -10000 - ecc. But I could consider also a dinamic solution. Ideally the best way for me will be in the front end, but if it is impossible i could consider also a previous aggregation in the script.
- Mark as New
- Bookmark
- Subscribe
- Mute
- Subscribe to RSS Feed
- Permalink
- Report Inappropriate Content
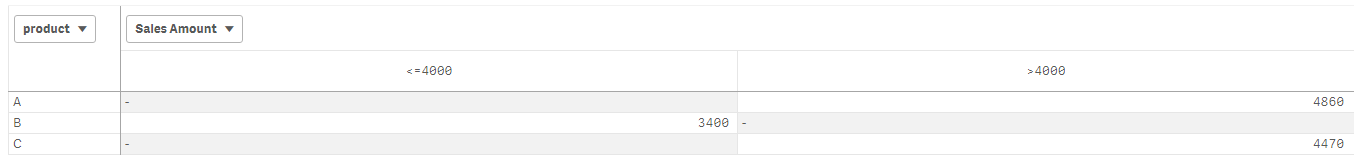
try this:
Finale:
LOAD
product,
"Sales price"
FROM [lib://source/PROVA_3.xlsx]
(ooxml, embedded labels, table is Data);
Left Join(Finale)
LOAD
product,
sum("Sales price") as SommeSales
Resident Finale
Group By product;
SalesTable:
LOAD product,
"Sales price",
if(SommeSales<=4000,'<=4000','>4000') as "Sales Amount"
Resident Finale;
DROP Table Finale;
here is the result I got:
If you wanna include Margin, here is what I did:
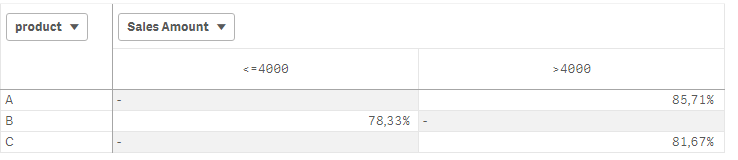
In the script:
Finale:
LOAD
product,
"Sales price",
"Margin %" AS Margin
FROM [lib://source/PROVA_3.xlsx]
(ooxml, embedded labels, table is Data);
Left Join(Finale)
LOAD
product,
sum("Sales price") as SommeSales,
Avg(Margin) as AvgMargin
Resident Finale
Group By product;
SalesTable:
LOAD product,
"Sales price",
AvgMargin,
if(SommeSales<=4000,'<=4000','>4000') as "Sales Amount"
Resident Finale;
DROP Table Finale;
Hope this could help you !
Ben Salem Omar,
- Mark as New
- Bookmark
- Subscribe
- Mute
- Subscribe to RSS Feed
- Permalink
- Report Inappropriate Content
Thanks Omar, but I need another thing. I need to create a new dimension based on a measure, I need to sum the sales until they reach 2000 and then until they reach 4000 and calculate the average margin. I need to see every field completed in my table.
Anyway thank you for your time
- Mark as New
- Bookmark
- Subscribe
- Mute
- Subscribe to RSS Feed
- Permalink
- Report Inappropriate Content
Something along these lines?
Dimension
product
Aggr(
If(RangeSum(Above(Sum([Sales price]), 0, RowNo())) < 2000, Dual('< 2000', 1),
If(RangeSum(Above(Sum([Sales price]), 0, RowNo())) < 4000, Dual('< 4000', 2),
If(RangeSum(Above(Sum([Sales price]), 0, RowNo())) < 6000, Dual('< 6000', 3),
If(RangeSum(Above(Sum([Sales price]), 0, RowNo())) < 8000, Dual('< 8000', 4),
If(RangeSum(Above(Sum([Sales price]), 0, RowNo())) < 10000, Dual('< 10000', 5)))))), product, (date,(NUMERICA, DESC)))
Expression
Avg([Margin %])
- Mark as New
- Bookmark
- Subscribe
- Mute
- Subscribe to RSS Feed
- Permalink
- Report Inappropriate Content
And the MVP iiiiis : as always  Thank you Sunny !
Now if I wanted to create this in the script; as I've done, what should we do?
- « Previous Replies
-
- 1
- 2
- Next Replies »