Unlock a world of possibilities! Login now and discover the exclusive benefits awaiting you.
- Qlik Community
- :
- All Forums
- :
- Visualization and Usability
- :
- Re: Calculating Average in Qlik Sense
- Subscribe to RSS Feed
- Mark Topic as New
- Mark Topic as Read
- Float this Topic for Current User
- Bookmark
- Subscribe
- Mute
- Printer Friendly Page
- Mark as New
- Bookmark
- Subscribe
- Mute
- Subscribe to RSS Feed
- Permalink
- Report Inappropriate Content
Calculating Average in Qlik Sense
Hi Everyone
Please refer this table
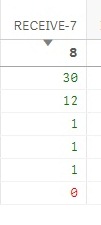
The top value (8) is showing Average for this column.
What I need is, the values which are below average should show in Red Color Else Green
here the values which are below 8, show in Red else Green.
This should work for filter also, suppose If I select only 10 records , result should show for only those 10 selected records.
- Mark as New
- Bookmark
- Subscribe
- Mute
- Subscribe to RSS Feed
- Permalink
- Report Inappropriate Content
Dear Shahzad,
You can use Avg with Aggregation to achieve it.
for example if you have
Dimension : CategoryName
Expression: Sum(Sales)
=if(Sum(Sales)>Avg(total Aggr(sum({<Sales={">0"}>}Sales),CategoryName)),green(),Red())
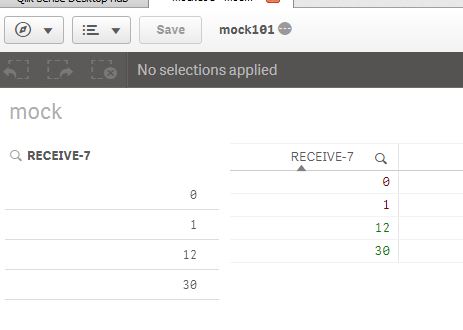
Kindly find the attached example for better understanding.
Thanks,
Mukram.
- Mark as New
- Bookmark
- Subscribe
- Mute
- Subscribe to RSS Feed
- Permalink
- Report Inappropriate Content
Hi,
try like this at your chart object -->dimension text color expression
=if([RECEIVE-7] < avg( total [RECEIVE-7]),Red(),Green())
- Mark as New
- Bookmark
- Subscribe
- Mute
- Subscribe to RSS Feed
- Permalink
- Report Inappropriate Content
Hi Mohammed & Devarasu
Both of your answer is working as a demo but not for my live data
My Measure is:
Count(if(TRANSACTION_DATE >= today()-7 and TRANSACTION_TYPE='RECEIVE', TRANSACTION_ID))
and I am using this condition for color but its not working:
if((Count(if(TRANSACTION_DATE >= today()-7 and TRANSACTION_TYPE='RECEIVE', TRANSACTION_ID))) >
Avg(total (if(TRANSACTION_DATE >= today()-7 and TRANSACTION_TYPE='RECEIVE', TRANSACTION_ID))),Green(),Red())
- Mark as New
- Bookmark
- Subscribe
- Mute
- Subscribe to RSS Feed
- Permalink
- Report Inappropriate Content
Hi,
Try like this?
=if(
Count(if(TRANSACTION_DATE >= today()-7 and TRANSACTION_TYPE='RECEIVE', TRANSACTION_ID)) <
avg( total Count(if(TRANSACTION_DATE >= today()-7 and TRANSACTION_TYPE='RECEIVE', TRANSACTION_ID)))
,Red(),Green() )
or try this
=if( Count(if(TRANSACTION_DATE >= today()-7 and TRANSACTION_TYPE='RECEIVE', TRANSACTION_ID)) <
(Count(total if(TRANSACTION_DATE >= today()-7 and TRANSACTION_TYPE='RECEIVE', TRANSACTION_ID)) / Count(distinct if(TRANSACTION_DATE >= today()-7 and TRANSACTION_TYPE='RECEIVE', TRANSACTION_ID)))
,Red(),Green())
If still not working, try to share your mock app with sample data.
Thanks,
Deva
- Mark as New
- Bookmark
- Subscribe
- Mute
- Subscribe to RSS Feed
- Permalink
- Report Inappropriate Content
Hi,
Can you try to use expression:
Count({<TRANSACTION_DATE ={">=Date(today()-7)"},TRANSACTION_TYPE={'RECEIVE'}>}TRANSACTION_ID)
for color condition:
=if(Count({<TRANSACTION_DATE ={">=Date(today()-7)"},TRANSACTION_TYPE={'RECEIVE'}>}TRANSACTION_ID)
>
Avg(Total Aggr(Count({<TRANSACTION_DATE ={">=Date(today()-7)"},TRANSACTION_TYPE={'RECEIVE'}>}TRANSACTION_ID),YOURDIMENSION)),green(),red())