Unlock a world of possibilities! Login now and discover the exclusive benefits awaiting you.
- Qlik Community
- :
- All Forums
- :
- Visualization and Usability
- :
- Re: Changing Graph type in between drill-down
- Subscribe to RSS Feed
- Mark Topic as New
- Mark Topic as Read
- Float this Topic for Current User
- Bookmark
- Subscribe
- Mute
- Printer Friendly Page
- Mark as New
- Bookmark
- Subscribe
- Mute
- Subscribe to RSS Feed
- Permalink
- Report Inappropriate Content
Changing Graph type in between drill-down
Hi experts,
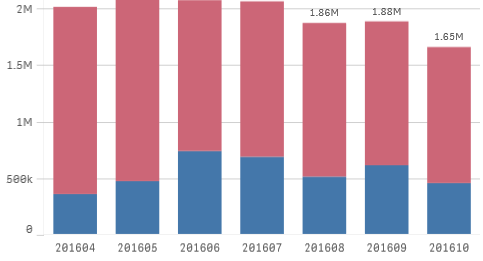
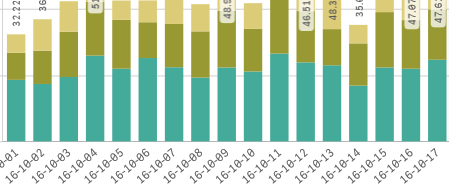
I have a requirement where I have to change the graph type from Stack to Normal bars in between drill.
for e.g.
X-Axis - Period --> Year, Quarter, Month, Date
Y-Axis Stack Bar - Product Sale -> Product Category, Product Type, Product Name
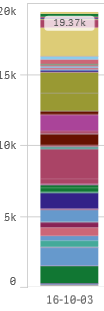
I want to change graph type to Normal Bar instead of Stack bar when I drill down to Product Name.
Regards, Nitin


Stack bar doesn't look good for selected date, hence I want to change this to Bar Chart.
Is this Possible?
Accepted Solutions
- Mark as New
- Bookmark
- Subscribe
- Mute
- Subscribe to RSS Feed
- Permalink
- Report Inappropriate Content
If you are using Qlik sense you can use 'Exploration menu" See screen shot below. Go to Presentation and change chart type. You can also add alternate dimension and measures and use them from exploration menu.
- Mark as New
- Bookmark
- Subscribe
- Mute
- Subscribe to RSS Feed
- Permalink
- Report Inappropriate Content
Unfortunately no.
- Mark as New
- Bookmark
- Subscribe
- Mute
- Subscribe to RSS Feed
- Permalink
- Report Inappropriate Content
Its not possible. .
Its better to have seperate chart for it.
- Mark as New
- Bookmark
- Subscribe
- Mute
- Subscribe to RSS Feed
- Permalink
- Report Inappropriate Content
In QlikView I have seen one option, where you can set multiple graph type, so that at the runtime user can change the graph view (FastChart).
- Mark as New
- Bookmark
- Subscribe
- Mute
- Subscribe to RSS Feed
- Permalink
- Report Inappropriate Content
It is a drill down option, hence I cannot have another chart, because that will consume screen real estate.
- Mark as New
- Bookmark
- Subscribe
- Mute
- Subscribe to RSS Feed
- Permalink
- Report Inappropriate Content
If you are using Qlik sense you can use 'Exploration menu" See screen shot below. Go to Presentation and change chart type. You can also add alternate dimension and measures and use them from exploration menu.
- Mark as New
- Bookmark
- Subscribe
- Mute
- Subscribe to RSS Feed
- Permalink
- Report Inappropriate Content
Hi Nitin,
It is not possible in Qliksense now, the work around is you need to display it another chart.
Regards,
Jagan.
- Mark as New
- Bookmark
- Subscribe
- Mute
- Subscribe to RSS Feed
- Permalink
- Report Inappropriate Content
Hi
This is close to what I am looking for, although there are limitation such as I cannot change chart type from Bar to Pie, but at least, it allows to change within same chart type group.
Regards, Nitin