Unlock a world of possibilities! Login now and discover the exclusive benefits awaiting you.
- Qlik Community
- :
- Forums
- :
- Analytics
- :
- New to Qlik Analytics
- :
- Re: Color by Expression
- Subscribe to RSS Feed
- Mark Topic as New
- Mark Topic as Read
- Float this Topic for Current User
- Bookmark
- Subscribe
- Mute
- Printer Friendly Page
- Mark as New
- Bookmark
- Subscribe
- Mute
- Subscribe to RSS Feed
- Permalink
- Report Inappropriate Content
Color by Expression
Hello Folks!
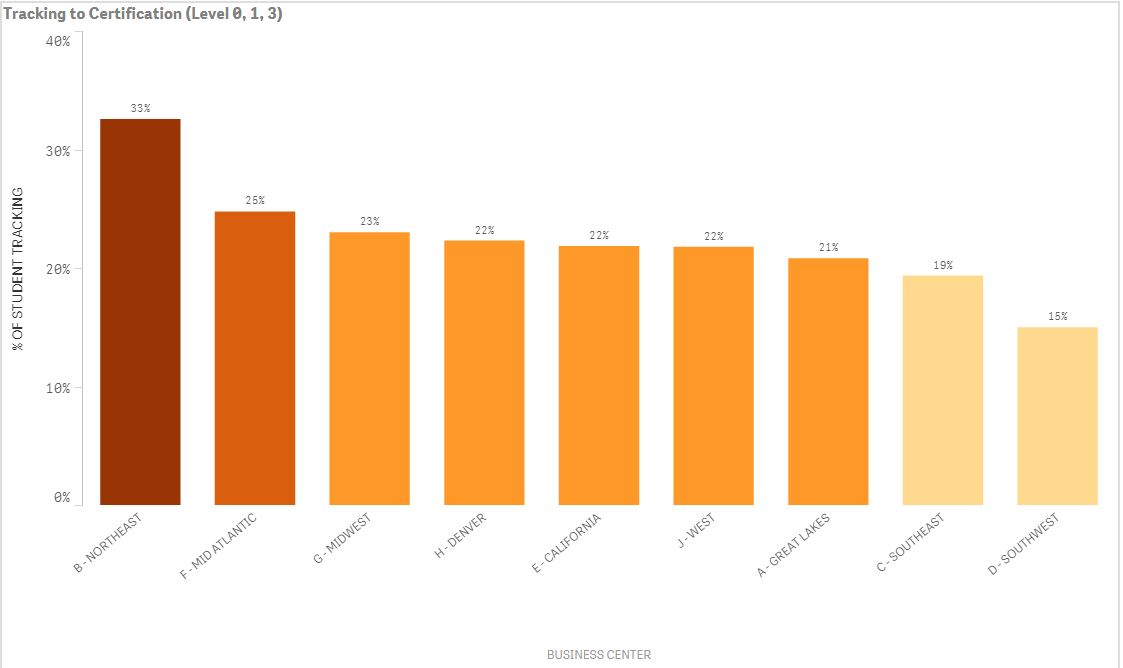
Question. I have a bar chart (see below). I currently have them sorted by the measure of highest % to lowest %. I want the highest % bar (regardless of the percent) to be green then a slow fade to yellow for the mid bar and slow fade to red to the lowest bar. I want them to match the style of my gauge (see below).
Any ideas how to write this expression? Let me know if more information is needed. Thanks!
Bar Chart - Green fade to yellow fade to red

Theme I want the bars to match ^

Dimensions = [BC]
Measure = Count({$<[LEVEL 0 COMPLETION]={"Y"},[LEVEL 1 COMPLETION]={"Y"},[LEVEL 3 COMPLETION]={"Y"}>}SID)/Count(SID)
Accepted Solutions
- Mark as New
- Bookmark
- Subscribe
- Mute
- Subscribe to RSS Feed
- Permalink
- Report Inappropriate Content
Hi Lauren
use this in your color by mesure panel :
color by expression :
ColorMix2( (rank(total column(1))/(noofrows(TOTAL)/2))-1 ,green(), yellow(),lightred())
Tips : you can set variable for colors so that if you use this color formula in several charts and want to change colors , you just have to change the variable rather than change manually all the color mesures
Hope it helps
- Mark as New
- Bookmark
- Subscribe
- Mute
- Subscribe to RSS Feed
- Permalink
- Report Inappropriate Content
Hi Bruno! Thanks for the reply! This is what I got below with that expression. I need the yellow in the middle and red at the end. Please advise.

- Mark as New
- Bookmark
- Subscribe
- Mute
- Subscribe to RSS Feed
- Permalink
- Report Inappropriate Content
I fixed it!
expression - ColorMix2( (rank(total column(1))/(noofrows(TOTAL)/2))-1 ,green(), lightred(),yellow()) <---- I rearranged the color order - not sure why this works but it works! Thanks!

- Mark as New
- Bookmark
- Subscribe
- Mute
- Subscribe to RSS Feed
- Permalink
- Report Inappropriate Content
Hi Lauren
Glad to read it works ![]()
for further information about this color theme approch see this post :
https://community.qlik.com/docs/DOC-14760
and this one
https://community.qlik.com/docs/DOC-16046
regards