Unlock a world of possibilities! Login now and discover the exclusive benefits awaiting you.
- Qlik Community
- :
- Forums
- :
- Analytics
- :
- New to Qlik Analytics
- :
- Count Distinct Accumulation in Qlik Sense
- Subscribe to RSS Feed
- Mark Topic as New
- Mark Topic as Read
- Float this Topic for Current User
- Bookmark
- Subscribe
- Mute
- Printer Friendly Page
- Mark as New
- Bookmark
- Subscribe
- Mute
- Subscribe to RSS Feed
- Permalink
- Report Inappropriate Content
Count Distinct Accumulation in Qlik Sense
It seems there are a lot of posts covering count distinct accumulation over time but none of which worked for me.
Here is a solution I made that seems simple.
I sorted my table in the load script by my dimension (month in my case). Then i used the following chart expression:
rangesum(
above(
sum(
aggr(
count(distinct "Name")
,"Name")
)
,0,RowNo())
)
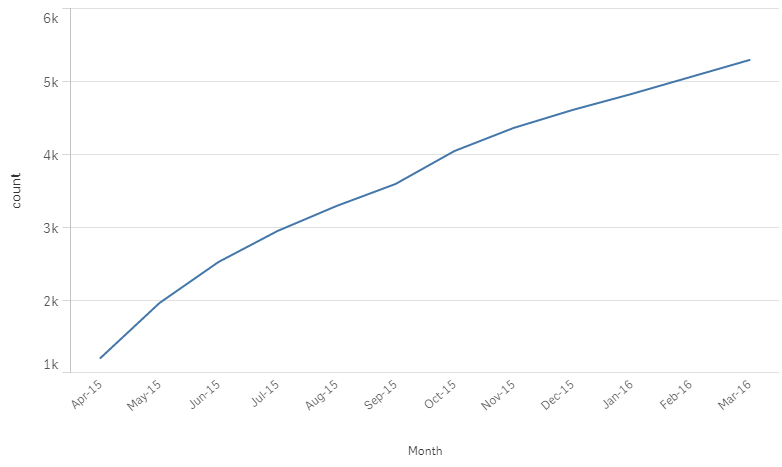
Obviously, you'll need to replace "Name" with the column you are distinctly counting. The result will be a nice accumulating line like below:
EDIT: For those curious about how this is working, it is an unintended result from a grain mis-match on the aggr function (not recommended but it does work). To explain, start by ignoring the "rangesum(above(" part of the expression. This is the part needed for the final accumulation. The inner part: "sum(aggr(count(distinct "Name"),"Name"))" is where we see strange behavior.
Starting with our sample data:
LOAD * INLINE [
Month, Name
1,A
1,B
1,C
1,D
1,E
2,F
2,G
2,A
2,B
2,C
2,D
3,H
3,A
3,B
3,C
];
Qlik evaluates sum(aggr(count(distinct "Name"),"Name")) by first applying it to our month dimension as in any chart (Month=1). It then jumps to the next dimension we've specified in the aggr function, "Name", and evaluates all instances of the given name. So "1,A", "2,A","3,A" are all evaluated for month =1 even though Month=1 is not the month associated with "2,A" and "3,A". Count(distinct Name) is then applied to these three rows and returns a count of 1. These steps are applied for each "Name" in Month =1 and returns a final count of 5.
Processing then jumps to month 2 and the evaluation steps continue but rows "2,A" through "2,D" are skipped because they were already evaluated when Month equaled 1. The final count returned for Month=2 is 2 ("2,F" and "2,G" are counted). Month 3 returns a count of 1 because all rows have been evaluated in previous steps with the exception of "3,H". The final result is this table:
| Month | Distinct Count by Month |
| 1 | 5 |
| 2 | 2 |
| 3 | 1 |
The reason this method is not recommended is because Qlik doesn't know how to apply the inner dimension (Name) with the outer dimension (Month). The load order is the only factor here that allows this to work. We've essentially gotten lucky that our load order happens to make this work. Had our table been loaded differently we would get a different result.
Say I move my second row, "1,B" to the bottom of my data load:
LOAD * INLINE [
Month, Name
1,A
1,C
1,D
1,E
2,F
2,G
2,A
2,B
2,C
2,D
3,H
3,A
3,B
3,C
1,B
];
The distinct count will now be 4,3,1 instead of the previous 5,2,1
| Month | Distinct Count by Month |
| 1 | 4 |
| 2 | 3 |
| 3 | 1 |
If we add in the accumulation part of the function ( "rangsum(above(" ) we arrive at the same final accumulation = 8 but the way we got there is different. See the attached sample app for these two examples.
Happy Qliking!
Mike
- Mark as New
- Bookmark
- Subscribe
- Mute
- Subscribe to RSS Feed
- Permalink
- Report Inappropriate Content
Can you attach the sample to play around with 
- Mark as New
- Bookmark
- Subscribe
- Mute
- Subscribe to RSS Feed
- Permalink
- Report Inappropriate Content
Sunny,
I'll try to update this post today. I just got some feedback from Henric Cronström on how this is working and I need to alter the expression and provide an explanation. It works, but it's not recommended because it's a grain mis-match on the aggr function.
Mike
- Mark as New
- Bookmark
- Subscribe
- Mute
- Subscribe to RSS Feed
- Permalink
- Report Inappropriate Content
Try this to get a plot of accumulated distinct count o"Name" vs Month or whatever time range you please.
aggr(rangesum(
above(
sum(
aggr(
count(distinct "Name")
,"Name")
)
,0,RowNo())),Month,(Numeric))
)
- Mark as New
- Bookmark
- Subscribe
- Mute
- Subscribe to RSS Feed
- Permalink
- Report Inappropriate Content
thank you so much. you saved my world with this formula! 🙂
- Mark as New
- Bookmark
- Subscribe
- Mute
- Subscribe to RSS Feed
- Permalink
- Report Inappropriate Content
I want to make clear something, if you use this formula, you HAVE TO sort your data when you're loading it. Otherwise it can give silly results.
- Mark as New
- Bookmark
- Subscribe
- Mute
- Subscribe to RSS Feed
- Permalink
- Report Inappropriate Content
@Emma1 Thanks for the expression. It was working in my scenario as well. Great help. Much appreciated.