Unlock a world of possibilities! Login now and discover the exclusive benefits awaiting you.
- Qlik Community
- :
- All Forums
- :
- Visualization and Usability
- :
- Re: Count If or Sum If values "Contain" text in a ...
- Subscribe to RSS Feed
- Mark Topic as New
- Mark Topic as Read
- Float this Topic for Current User
- Bookmark
- Subscribe
- Mute
- Printer Friendly Page
- Mark as New
- Bookmark
- Subscribe
- Mute
- Subscribe to RSS Feed
- Permalink
- Report Inappropriate Content
Count If or Sum If values "Contain" text in a line chart
Hello Community! this is my first question/post, so I am super excited LOL!
I have looked and looked but have not found the answer, so I felt it's finally time to break down and ask the question.
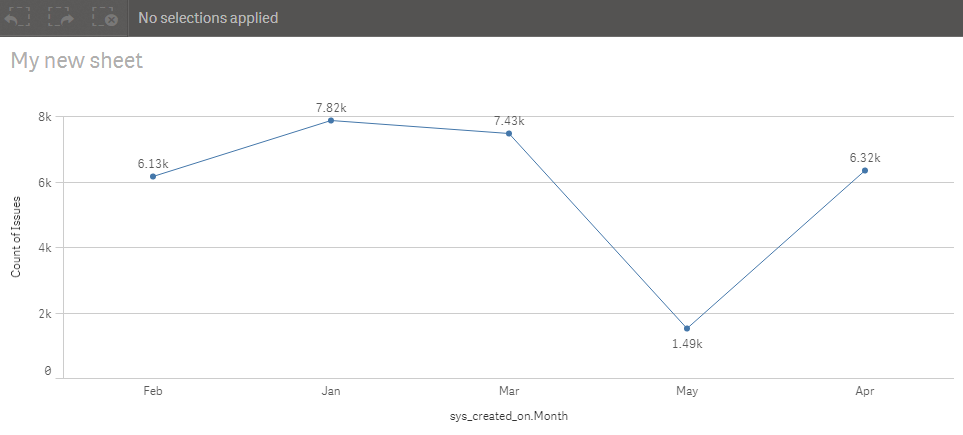
I am trying to create a line chart or a bar chart, either or is ok with time series data and strings of text. The issue is that not all of my data values are equal. A common string of text looks like this ("Shut down AV system left on after meeting"). I would like to filter only on data that contains 'left on' and then count how many times I see this "string" of text per month so we can trend/track a reduction in cases that we have to dispatch a technician to a site to turn off the audio-visual equipment.
I have tried the following --> =count(if(match(close_notes, 'left on'),1,0)) but this is not giving me the return that i am looking for when i put this formula in the "measures" "label" formula section. It's actually giving me just the normal count of "close notes" the data set has
PLEASE HELP! and ++ Karma points if it works 
- Mark as New
- Bookmark
- Subscribe
- Mute
- Subscribe to RSS Feed
- Permalink
- Report Inappropriate Content
Well, of course after I post, I found the answer to my own question, sorry guys for the waste of time.
To resolve this I had to use "Sub_String" in the formula, for example --> =sum(if(SubStringCount(close_notes,'left on'),1,0))
Sorry in advance, but I fixed my own issues LOL! Thanks anyway!!
- Mark as New
- Bookmark
- Subscribe
- Mute
- Subscribe to RSS Feed
- Permalink
- Report Inappropriate Content
I suggest using set analysis like this
Sum({<close_notes = {'*left on*'}>} close_notes)
- Mark as New
- Bookmark
- Subscribe
- Mute
- Subscribe to RSS Feed
- Permalink
- Report Inappropriate Content
Thank you for the reply, the solution to my issue was --> =sum(if(SubStringCount(close_notes,'left on'),1,0))
- Mark as New
- Bookmark
- Subscribe
- Mute
- Subscribe to RSS Feed
- Permalink
- Report Inappropriate Content
Did you even try with set analysis my friend?
- Mark as New
- Bookmark
- Subscribe
- Mute
- Subscribe to RSS Feed
- Permalink
- Report Inappropriate Content
I tried your solution Sunny, works fine.