Unlock a world of possibilities! Login now and discover the exclusive benefits awaiting you.
- Qlik Community
- :
- Forums
- :
- Analytics
- :
- New to Qlik Analytics
- :
- Count active workers per month
- Subscribe to RSS Feed
- Mark Topic as New
- Mark Topic as Read
- Float this Topic for Current User
- Bookmark
- Subscribe
- Mute
- Printer Friendly Page
- Mark as New
- Bookmark
- Subscribe
- Mute
- Subscribe to RSS Feed
- Permalink
- Report Inappropriate Content
Count active workers per month
Hello,
I have this problem. I have a list of contingen workers, each worker has a starting date and end date.
| Start Date | End Date |
| 12/27/2016 | 1/17/2017 |
I would like to create a Bar Chart for the year 2017 (Jan to Dec) and count how many active workers I have in that specific month. I can use/count distinct the ID or Name of the worker. The problem is that in some cases I have a worker that started in Oct 2016 and will end his contract in Sep 2018 and in that case the worker will be active each month during 2017, but I have other cases where the worker started in Dec 2016 and will end his contract in Jan 2017, so I can only count that worker as active in Jan 2017 but not the rest of the month of 2017.
Any idea? I am ataching a sample data.
Best,
Ignacio
- Mark as New
- Bookmark
- Subscribe
- Mute
- Subscribe to RSS Feed
- Permalink
- Report Inappropriate Content
Hi Ignacio,
may be this
Table:
LOAD * FROM
https://community.qlik.com/servlet/JiveServlet/download/1361353-299394/Contingent%20Worker%20Sample....
(ooxml, embedded labels, table is Sheet1);
LOAD DISTINCT [Contingent Worker],MonthName([Start Date]+IterNo()-1) as Month,
Year([Start Date]+IterNo()-1) as Year
Resident Table
While [Start Date]+IterNo() <= [End Date];

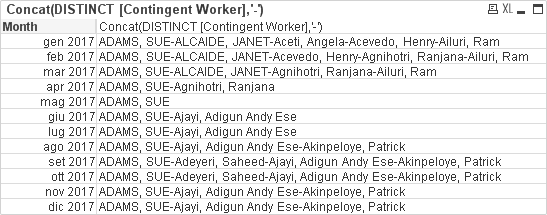
Regards,
Antonio
- Mark as New
- Bookmark
- Subscribe
- Mute
- Subscribe to RSS Feed
- Permalink
- Report Inappropriate Content
Thank you very much with this, i have created my requirement.