- Mark as New
- Bookmark
- Subscribe
- Mute
- Subscribe to RSS Feed
- Permalink
- Report Inappropriate Content
Cummulative sum with buckets in the dimension
How to build a logic for "cumulative sum "with buckets in Dimension in a tabular report
Dimension : [PAID RANGE NEW]
Measure : amount
Below is the inline table i created in the data load editor
paid_period_12group:
Load * inline
[paid_period_id_new, "Paid Range New"
1,'>$500M'
2,'$500M - $100M'
3,'$100M - $50M'
4,'$50M - $10M'
5,'$10M - $1M'
6,'$1M - $500K'
7,'$500K - $400K'
8,'$400K - 100K'
9,'$100K - $25K'
10,'$25K - $2500'
11,'$2500 - $100'
12,'$100 - $0'
13,'<$0'
];
TIA
- « Previous Replies
-
- 1
- 2
- Next Replies »
- Mark as New
- Bookmark
- Subscribe
- Mute
- Subscribe to RSS Feed
- Permalink
- Report Inappropriate Content
Hi,
do you need a logic to help you on how to calculate this ?
or do you have calculation rule and you just want a solution to have your Range sum ?
- Mark as New
- Bookmark
- Subscribe
- Mute
- Subscribe to RSS Feed
- Permalink
- Report Inappropriate Content
Hi Youssef
I need the logic on how to calculate cumulative sum for these buckets
- Mark as New
- Bookmark
- Subscribe
- Mute
- Subscribe to RSS Feed
- Permalink
- Report Inappropriate Content
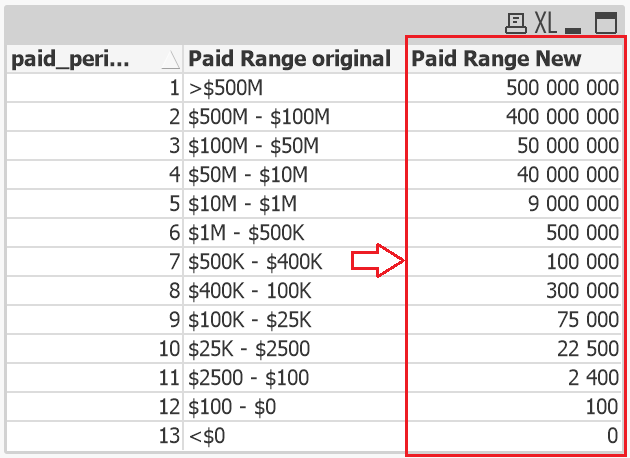
Hi,
One solution to solve this would be to transform your data this way

it is ok for you ?
- Mark as New
- Bookmark
- Subscribe
- Mute
- Subscribe to RSS Feed
- Permalink
- Report Inappropriate Content
Hi Youssef,
I am sorry , can you please elaborate how it can be done in Qliksense,
Thank you .
- Mark as New
- Bookmark
- Subscribe
- Mute
- Subscribe to RSS Feed
- Permalink
- Report Inappropriate Content
The result on the right column are ok for you ??
- Mark as New
- Bookmark
- Subscribe
- Mute
- Subscribe to RSS Feed
- Permalink
- Report Inappropriate Content
Let's assume you hav this as source (with amount):
[paid_period_id_new, "Paid Range New",Amount
1,'>$500M',50
2,'$500M - $100M',300
3,'$100M - $50M',523
4,'$50M - $10M',800
5,'$10M - $1M',30
6,'$1M - $500K',500
7,'$500K - $400K',100
8,'$400K - 100K',600
9,'$100K - $25K',50
10,'$25K - $2500',30
11,'$2500 - $100',500
12,'$100 - $0',63
13,'<$0',50
];
do as follow:
Load *, AutoNumberHash256(SubField([Paid Range New],'-',1)) as sorting inline
[paid_period_id_new, "Paid Range New",Amount
1,'>$500M',50
2,'$500M - $100M',300
3,'$100M - $50M',523
4,'$50M - $10M',800
5,'$10M - $1M',30
6,'$1M - $500K',500
7,'$500K - $400K',100
8,'$400K - 100K',600
9,'$100K - $25K',50
10,'$25K - $2500',30
11,'$2500 - $100',500
12,'$100 - $0',63
13,'<$0',50
];
Now create a simple table;
as dimension:
Paid Range New
as measures:
sum(Amount)
and
for cumulated:
aggr(rangesum(Above(Sum(Amount),0,RowNo())),(sorting,(numeric,desc) ))
sort it as follow:
Result:
ps: even when u change the sorting; the number won't be changing; it'll always calculate the right cumul :
Hope this helps
- Mark as New
- Bookmark
- Subscribe
- Mute
- Subscribe to RSS Feed
- Permalink
- Report Inappropriate Content
Hi Omar,
If we enter amount manually in the data load editor and when we move the app to production the values will not change dynamically . So is there any way the data changes dynamically when we move the app to Prod,
Thank you .
- Mark as New
- Bookmark
- Subscribe
- Mute
- Subscribe to RSS Feed
- Permalink
- Report Inappropriate Content
Here is one method/logic for me to take your "raw" buckets, to transform them into clean values to be able to use them into a cumulative expression.
the script is bit long to post here, so please find attached the QVF.
If you can't understand the way I proceeded, don't hesitate to ask your questions.
- Mark as New
- Bookmark
- Subscribe
- Mute
- Subscribe to RSS Feed
- Permalink
- Report Inappropriate Content
I was assuming that ur Paid Range New dimension is already associaed with Amount field that's maybe present in another table..
u don't have to add it manually.. it's just for the sake of this example so that u can understand and maybe replicate what i was doing.
u can use ur Amount field..
Hope that was helpful
- « Previous Replies
-
- 1
- 2
- Next Replies »