Unlock a world of possibilities! Login now and discover the exclusive benefits awaiting you.
- Qlik Community
- :
- All Forums
- :
- Visualization and Usability
- :
- Cumulative current and previous year comparison
- Subscribe to RSS Feed
- Mark Topic as New
- Mark Topic as Read
- Float this Topic for Current User
- Bookmark
- Subscribe
- Mute
- Printer Friendly Page
- Mark as New
- Bookmark
- Subscribe
- Mute
- Subscribe to RSS Feed
- Permalink
- Report Inappropriate Content
Cumulative current and previous year comparison
HI,
I have these data ant I need to compare current and previous year sales and cumulative current and previous year sales:
| Year | Month | current Sales | Previous sales | Sales evolution | current Cumulative Sales | Previous cumulative sales | previous Sales evolution |
| 2016 | jan. | $ 3.210.255,67 | $ 2.916.318,75 | $ 3.210.255,67 | $ 2.916.318,75 | ||
| 2016 | feb. | $ 2.416.694,16 | $ 2.619.870,73 | $ 5.626.949,83 | $ 5.536.189,48 | ||
| 2016 | mar. | $ 3.136.653,17 | $ 3.427.868,53 | $ 8.763.603,00 | $ 8.964.058,01 | ||
| 2016 | apr. | $ 3.014.915,70 | $ 2.970.871,88 | $ 11.778.518,70 | $ 11.934.929,89 | ||
| 2016 | may. | $ 3.224.530,82 | $ 2.936.163,16 | $ 15.003.049,52 | $ 14.871.093,05 | ||
| 2016 | jun. | $ 3.122.416,11 | $ 2.879.275,88 | $ 18.125.465,63 | $ 17.750.368,93 | ||
| 2016 | jul. | $ 3.820.239,27 | $ 3.237.616,84 | $ 21.945.704,90 | $ 20.987.985,77 | ||
| 2016 | aug. | $ 3.057.424,10 | $ 3.519.914,18 | $ 25.003.129,00 | $ 24.507.899,95 | ||
| 2016 | sept. | $ 3.191.870,08 | $ 3.790.792,88 | $ 28.194.999,08 | $ 28.298.692,83 | ||
| 2016 | oct. | $ 3.233.443,83 | $ 3.234.116,17 | $ 31.428.442,91 | $ 31.532.809,00 | ||
| 2016 | nov. | $ 2.600.200,37 | $ 2.815.782,99 | $ 34.028.643,28 | $ 34.348.591,99 | ||
| 2016 | dic. | $ 3.014.417,02 | $ 2.915.944,48 | $ 37.043.060,30 | $ 37.264.536,47 | ||
| 2017 | jan. | $ 2.655.247,31 | $ 3.210.255,67 | 17,29% | $ 2.655.247,31 | $ 3.210.255,67 | 17,29% |
| 2017 | feb. | $ 3.012.526,90 | $ 2.416.694,16 | -24,65% | $ 5.667.774,21 | $ 5.626.949,83 | -0,73% |
| 2017 | mar. | $ 3.291.494,73 | $ 3.136.653,17 | -4,94% | $ 8.959.268,94 | $ 8.763.603,00 | -2,23% |
| 2017 | apr. | $ 3.100.229,69 | $ 3.014.915,70 | -2,83% | $ 12.059.498,63 | $ 11.778.518,70 | -2,39% |
| 2017 | may. | $ 3.801.179,75 | $ 3.224.530,82 | -17,88% | $ 15.860.678,38 | $ 15.003.049,52 | -5,72% |
| 2017 | jun. | $ 3.302.255,26 | $ 3.122.416,11 | -5,76% | $ 19.162.933,64 | $ 18.125.465,63 | -5,72% |
| 2017 | jul. | $ 3.104.700,53 | $ 3.820.239,27 | 18,73% | $ 22.267.634,17 | $ 21.945.704,90 | -1,47% |
| 2017 | aug. | $ 3.977.982,00 | $ 3.057.424,10 | -30,11% | $ 26.245.616,17 | $ 25.003.129,00 | -4,97% |
| 2017 | sept. | $ 3.211.017,79 | $ 3.191.870,08 | -0,60% | $ 29.456.633,96 | $ 28.194.999,08 | -4,47% |
| 2017 | oct. | $ 3.705.129,89 | $ 3.233.443,83 | -14,59% | $ 33.161.763,85 | $ 31.428.442,91 | -5,52% |
| 2017 | nov. | $ 3.247.800,47 | $ 2.600.200,37 | -24,91% | $ 36.409.564,32 | $ 34.028.643,28 | -7,00% |
| 2017 | dic. | $ 3.351.796,31 | $ 3.014.417,02 | -11,19% | $ 39.761.360,63 | $ 37.043.060,30 | -7,34% |
I used this scrip:
vCurrentYear = Max(Year)
vPreviousYear = Max(Year-1)
vCurrentSales = sum({<Year={$(vCurrentYear)}>}Sales)
vPreviousSales = sum({<Year={$(vPreviousYear)}>}Sales)
vSalesEvolution = 1 - $(vCurrentSales)/$(vPreviousSales)
vCumSales = RangeSum(Above($(vCurrentSales), 0, RowNo()))
vCumPreviousSales = RangeSum(Above($(vPreviousSales), 0, RowNo()))
vCumSalesEvolution = 1 - $(vCurrentSales)/$(vPreviousSales)
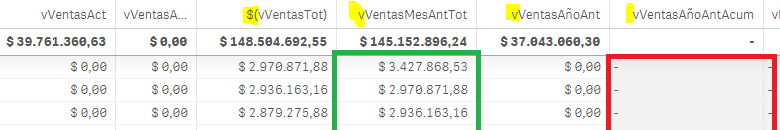
I have these results for current sales:
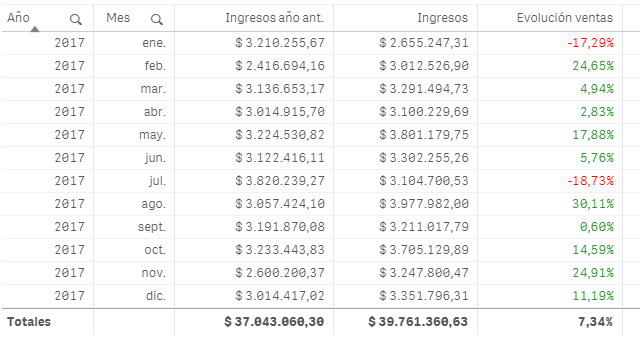
But I can have the results for cumulative sales:
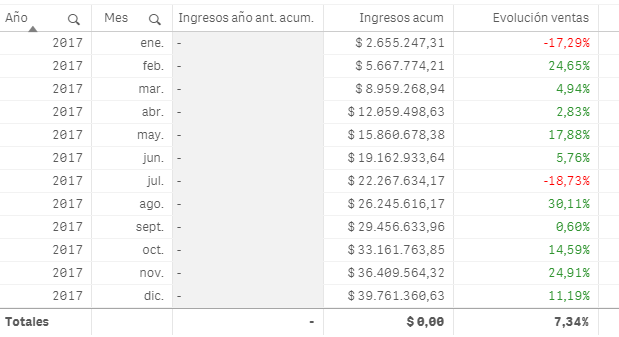
Could someone help me please?
- Mark as New
- Bookmark
- Subscribe
- Mute
- Subscribe to RSS Feed
- Permalink
- Report Inappropriate Content
Thanks for your answer.
I´m trying to have cumulative past year sales. I already have cumulative this year sales in a way I postet at the beguining (year by year)
- Mark as New
- Bookmark
- Subscribe
- Mute
- Subscribe to RSS Feed
- Permalink
- Report Inappropriate Content
1) Can you please double check that you have the same variable settings. For vPreviousYear there is the equal sign and for vPreviousSales there is no equal sign.
2) When you said it doesn't work, does it show null or what?
3) In your real app, does the previous sales show correctly?
4) Which version are you using?
- Mark as New
- Bookmark
- Subscribe
- Mute
- Subscribe to RSS Feed
- Permalink
- Report Inappropriate Content
Hi Fei, thanks for your answer.
1) Hay have the = sign in both cases (remember that I work in spanish)
2) It shows nothing
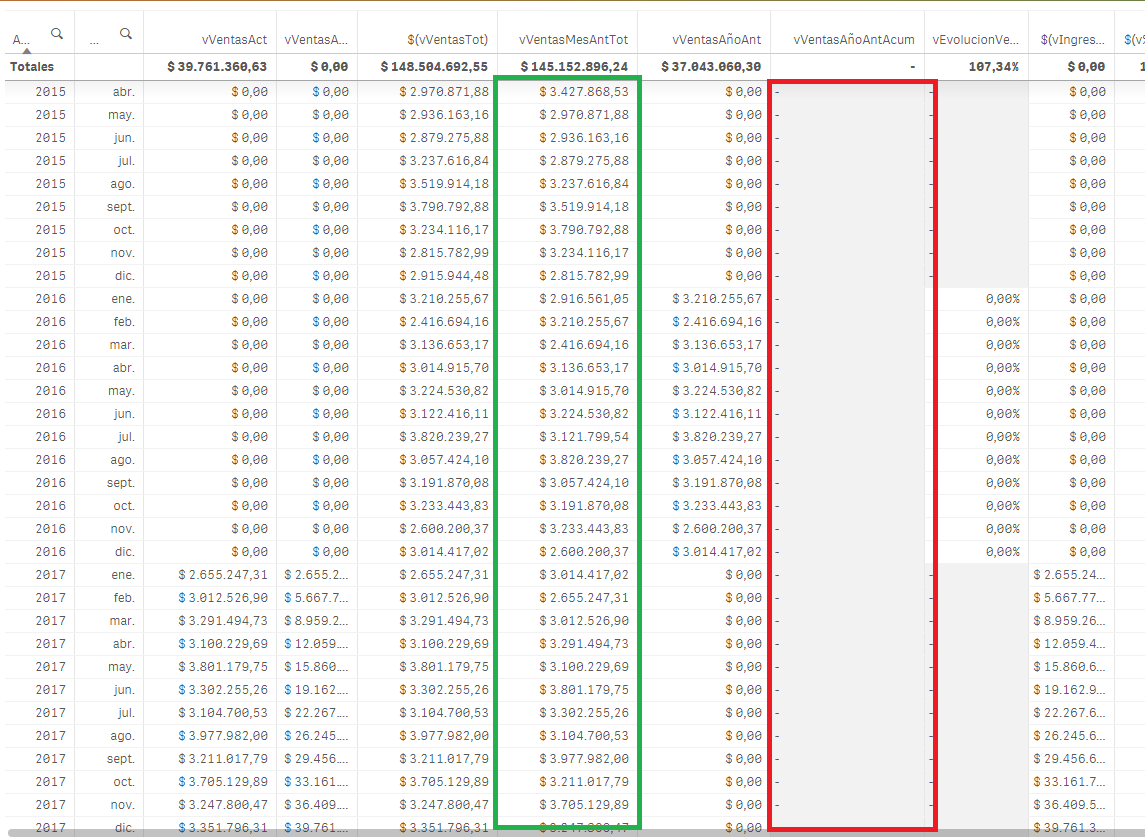
3) yes (see green line in previous image)
4) I´m using QlikSense february2018 version
- Mark as New
- Bookmark
- Subscribe
- Mute
- Subscribe to RSS Feed
- Permalink
- Report Inappropriate Content
Can you please show us the variables for vPreviousSales and the vCummPreviousSales (Spanish is fine, we can check the expressions)?
Why did you use $() for current year but no dollar sign $() for last year?
- Mark as New
- Bookmark
- Subscribe
- Mute
- Subscribe to RSS Feed
- Permalink
- Report Inappropriate Content
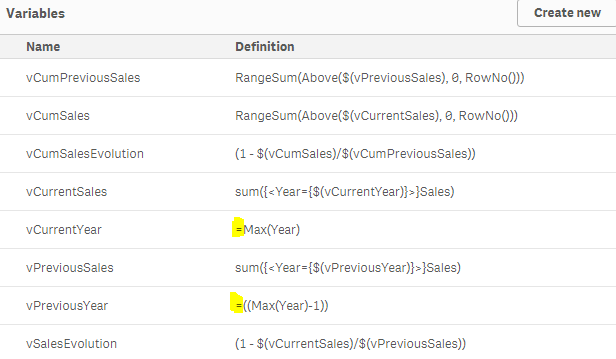
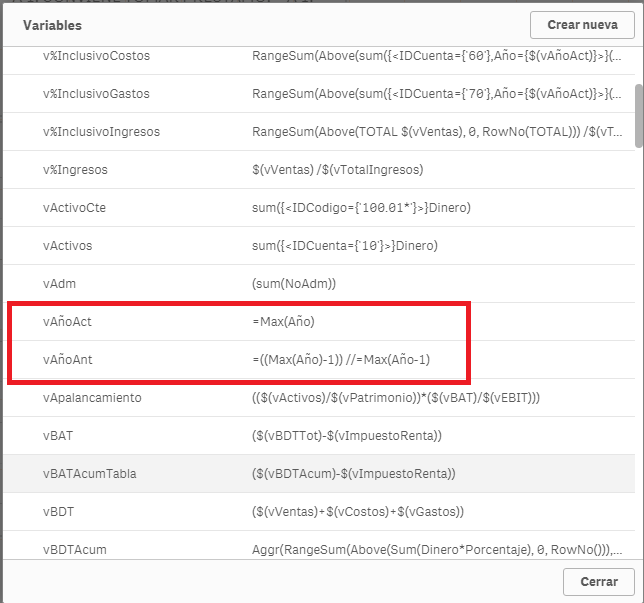
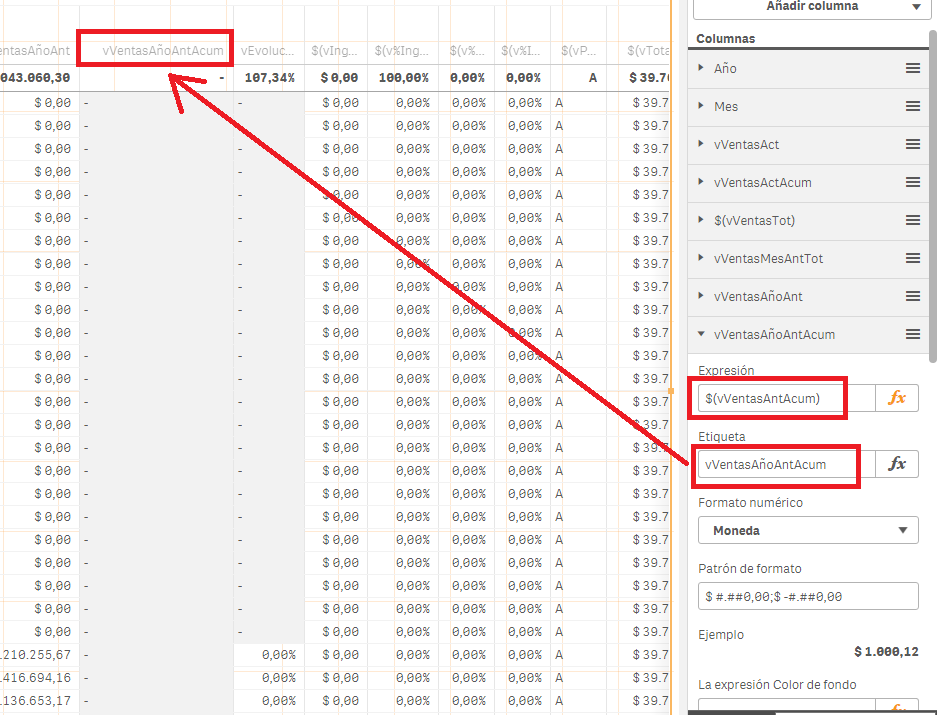
These are the viariables that I have (in black, the variables of the qvf file, in red, the variables in the original model)
vCurrentYear = Max(Year)
vAñoAct = Max(Año)
vPreviousYear = Max(Year-1)
vAñoAnt=((Max(Año)-1))
vCurrentSales = sum({<Year={$(vCurrentYear)}>}Sales)
vVentas = sum({<IDCuenta={'40'},Año={$(vAñoAct)}>}Dinero*Porcentaje)
vPreviousSales = sum({<Year={$(vPreviousYear)}>}Sales)
vVentasAnt = sum({<IDCuenta={'40'},Año={$(vAñoAnt)}>}Dinero*Porcentaje)
vSalesEvolution = 1 - $(vCurrentSales)/$(vPreviousSales)
vEvolucionVentas = 1 - $(vVentas)/$(vVentasAnt)
vCumSales = RangeSum(Above($(vCurrentSales), 0, RowNo()))
vVentasAcum = RangeSum(Above($(vVentas), 0, RowNo()))
vCumPreviousSales = RangeSum(Above($(vPreviousSales), 0, RowNo()))
vVentasAntAcum = RangeSum(Above($(vVentasAnt), 0, RowNo()))
vCumSalesEvolution = 1 - $(vCurrentSales)/$(vPreviousSales)
vEvolucionVentasAcum = 1 - $(vVentasAcum)/$(vVentasAntAcum)
“Why did you use $() for current year but no dollar sign $() for last year?” Where did you see that?
- Mark as New
- Bookmark
- Subscribe
- Mute
- Subscribe to RSS Feed
- Permalink
- Report Inappropriate Content
From your screenshot:
- Mark as New
- Bookmark
- Subscribe
- Mute
- Subscribe to RSS Feed
- Permalink
- Report Inappropriate Content
ahh, don´t pay attention on that. They are only fantasy names
- Mark as New
- Bookmark
- Subscribe
- Mute
- Subscribe to RSS Feed
- Permalink
- Report Inappropriate Content
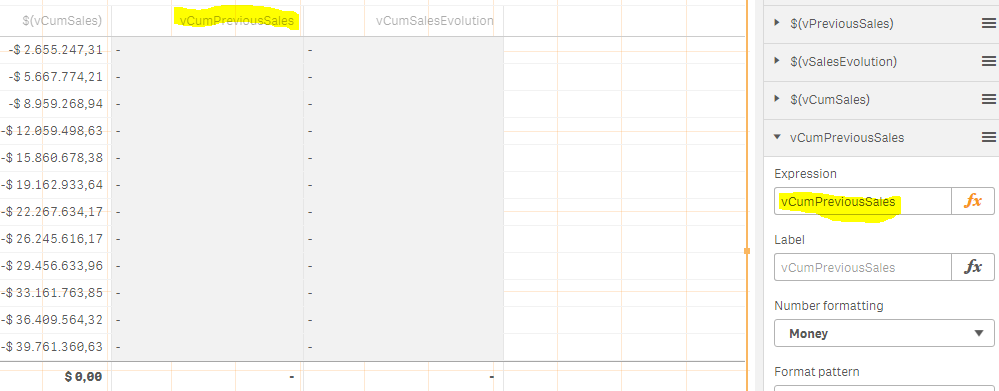
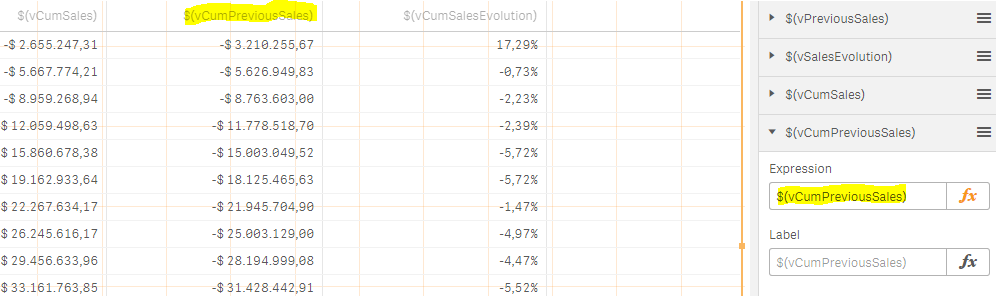
The label name doesn't matter but the expression does.
vCumPreviousSales will not work:
$(vCumPreviousSales) will work:
- Mark as New
- Bookmark
- Subscribe
- Mute
- Subscribe to RSS Feed
- Permalink
- Report Inappropriate Content
This is the script. I think it is correct, despite the label is not.
But I'll appreciate if you see something wrong
- Mark as New
- Bookmark
- Subscribe
- Mute
- Subscribe to RSS Feed
- Permalink
- Report Inappropriate Content
Can't find anything wrong. Sorry, couldn't provide any help.