Unlock a world of possibilities! Login now and discover the exclusive benefits awaiting you.
- Qlik Community
- :
- Forums
- :
- Analytics
- :
- New to Qlik Analytics
- :
- Re: Current Month Dimension QS
- Subscribe to RSS Feed
- Mark Topic as New
- Mark Topic as Read
- Float this Topic for Current User
- Bookmark
- Subscribe
- Mute
- Printer Friendly Page
- Mark as New
- Bookmark
- Subscribe
- Mute
- Subscribe to RSS Feed
- Permalink
- Report Inappropriate Content
Current Month Dimension QS
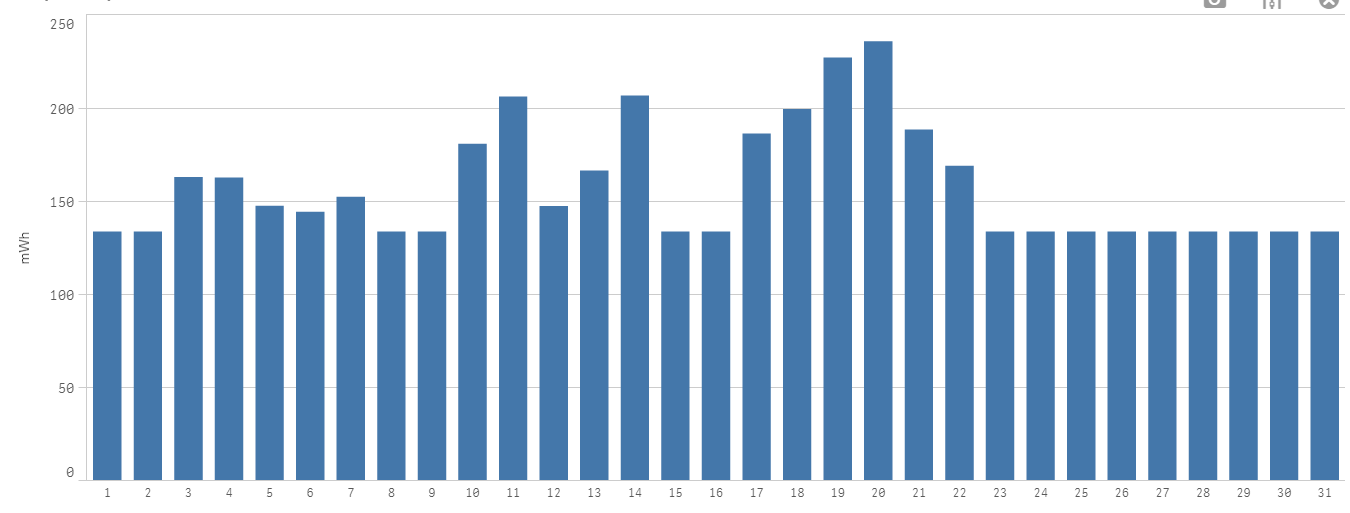
I am trying to show in a graph the sales of the current month by day, my expression is correct but the dimension does not adjust to the days of the current month. Could you help me?
For September the graph should arrive at 24 and show me the full month from 1 to 30.
Dimension:
Day(DATE)
Expression:
SUM({<[Date.autoCalendar.Year]={'$(vMaxYear)'},
[Date.autoCalendar.Month]={'$(vMaxMonth)'},[Date.autoCalendar.Day]={'<=$(vMaxDay)'},
Date=,[Date.autoCalendar.YearMonth]=>}SALES)
- Mark as New
- Bookmark
- Subscribe
- Mute
- Subscribe to RSS Feed
- Permalink
- Report Inappropriate Content
How is the vMaxDay defined?
If u put it in a KPI object, what does it return?
Try sthing like :
SUM({<[Date.autoCalendar.Year]={'$(vMaxYear)'},
[Date.autoCalendar.Month]={'$(vMaxMonth)'},
Date={"$<=(=Date(today(1)))"},[Date.autoCalendar.YearMonth]=>}SALES)
- Mark as New
- Bookmark
- Subscribe
- Mute
- Subscribe to RSS Feed
- Permalink
- Report Inappropriate Content
It returns data from 1 to 24 September, so it should be shown in the graph, I have to do a calculated dimension I guess.
- Mark as New
- Bookmark
- Subscribe
- Mute
- Subscribe to RSS Feed
- Permalink
- Report Inappropriate Content
What returns data from 1 to 24?
- Mark as New
- Bookmark
- Subscribe
- Mute
- Subscribe to RSS Feed
- Permalink
- Report Inappropriate Content
Right 