Unlock a world of possibilities! Login now and discover the exclusive benefits awaiting you.
- Qlik Community
- :
- Forums
- :
- Analytics
- :
- New to Qlik Analytics
- :
- Re: Custom Color In Charts
- Subscribe to RSS Feed
- Mark Topic as New
- Mark Topic as Read
- Float this Topic for Current User
- Bookmark
- Subscribe
- Mute
- Printer Friendly Page
- Mark as New
- Bookmark
- Subscribe
- Mute
- Subscribe to RSS Feed
- Permalink
- Report Inappropriate Content
Custom Color In Charts
Hi,
I have seen many discussion on custom color change in charts, But I am not sure why my chart is not getting change.
I have attached QVD file. I need like below

- Mark as New
- Bookmark
- Subscribe
- Mute
- Subscribe to RSS Feed
- Permalink
- Report Inappropriate Content
your coloring expression will not work because it is incomplete
IF(Count({$<[Overdue/Ontime/Completed]={'Completed'}>}[ID Number]),RGB(255,0,0),
IF(Count({$<[Overdue/Ontime/Completed]={'Overdue'}>}[ID Number]),RGB(0,255,0),
IF(Count({$<[Overdue/Ontime/Completed]={'Ontime'}>}[ID Number]),RGB(0,128,0))))
you need to set a condition, which is missing on your expression
example:
IF(Count({$<[Overdue/Ontime/Completed]={'Completed'}>}[ID Number]) = ?,RGB(255,0,0),
IF(Count({$<[Overdue/Ontime/Completed]={'Overdue'}>}[ID Number]) = ?,RGB(0,255,0),
IF(Count({$<[Overdue/Ontime/Completed]={'Ontime'}>}[ID Number]) = ?,RGB(0,128,0))))
you can also use operators like: >, <, >=, <=
- Mark as New
- Bookmark
- Subscribe
- Mute
- Subscribe to RSS Feed
- Permalink
- Report Inappropriate Content
Hi Dipesh;
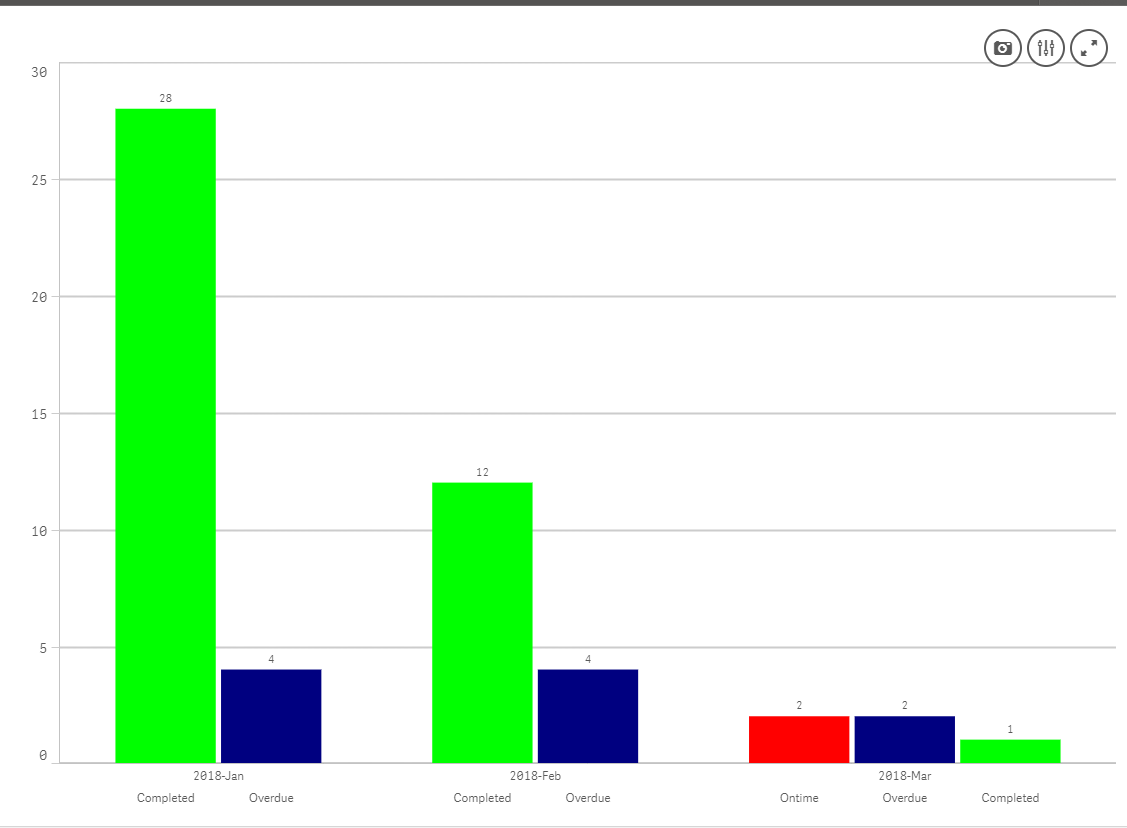
I have changed the code little bit. The result is like below. I have added date and [Overdue/Ontime/Completed] column as a dimension than I have counted the ID number.
I have used the below expression for color code;
IF([Overdue/Ontime/Completed]='Completed',RGB(0,255,0),
if([Overdue/Ontime/Completed]='Ontime',RGB(255,0,0),
if([Overdue/Ontime/Completed]='Overdue',RGB(0,0,128))))
I hope this is what you want.

Regards;
O.Y