Unlock a world of possibilities! Login now and discover the exclusive benefits awaiting you.
- Qlik Community
- :
- Forums
- :
- Analytics
- :
- New to Qlik Analytics
- :
- Re: Customised coloured area in line chart?
- Subscribe to RSS Feed
- Mark Topic as New
- Mark Topic as Read
- Float this Topic for Current User
- Bookmark
- Subscribe
- Mute
- Printer Friendly Page
- Mark as New
- Bookmark
- Subscribe
- Mute
- Subscribe to RSS Feed
- Permalink
- Report Inappropriate Content
Customised coloured area in line chart?
Hi all,
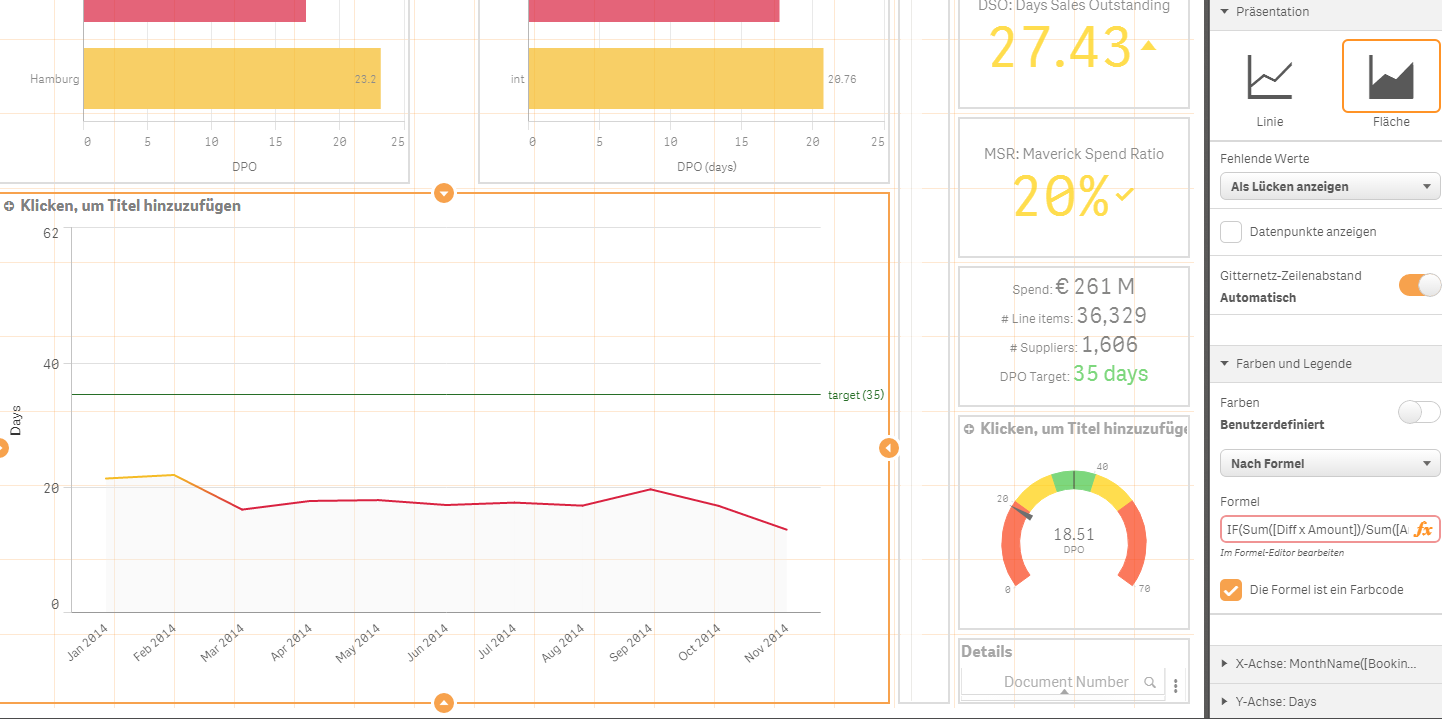
I'm trying to colour the area underneath the line of a line-chart according to the following nested if-statement:
IF(Sum([Diff x Amount])/Sum([Amount in Euro])<20,kRed,
if(Sum([Diff x Amount])/Sum([Amount in Euro])<30, kYellow,
if(Sum([Diff x Amount])/Sum([Amount in Euro])<40, kGreen,
if(Sum([Diff x Amount])/Sum([Amount in Euro])<50, kYellow,
kRed
))))
However, despite selecting "Area" as presentation mode (Präsentation: Fläche in German), only the line is coloured and now area is visible.
Thank you for your help!
- Mark as New
- Bookmark
- Subscribe
- Mute
- Subscribe to RSS Feed
- Permalink
- Report Inappropriate Content
Can you not change the style on the Style tab?
- Mark as New
- Bookmark
- Subscribe
- Mute
- Subscribe to RSS Feed
- Permalink
- Report Inappropriate Content
Or in the xepressions tab there is a drop down under the xepression which allows you to put the format in against the background colour rather than the line format.
- Mark as New
- Bookmark
- Subscribe
- Mute
- Subscribe to RSS Feed
- Permalink
- Report Inappropriate Content
Hey Peter,
sorry, don't really understand what you are reffering to. This is QlikSense, not QlikView...
- Mark as New
- Bookmark
- Subscribe
- Mute
- Subscribe to RSS Feed
- Permalink
- Report Inappropriate Content
Hi David,
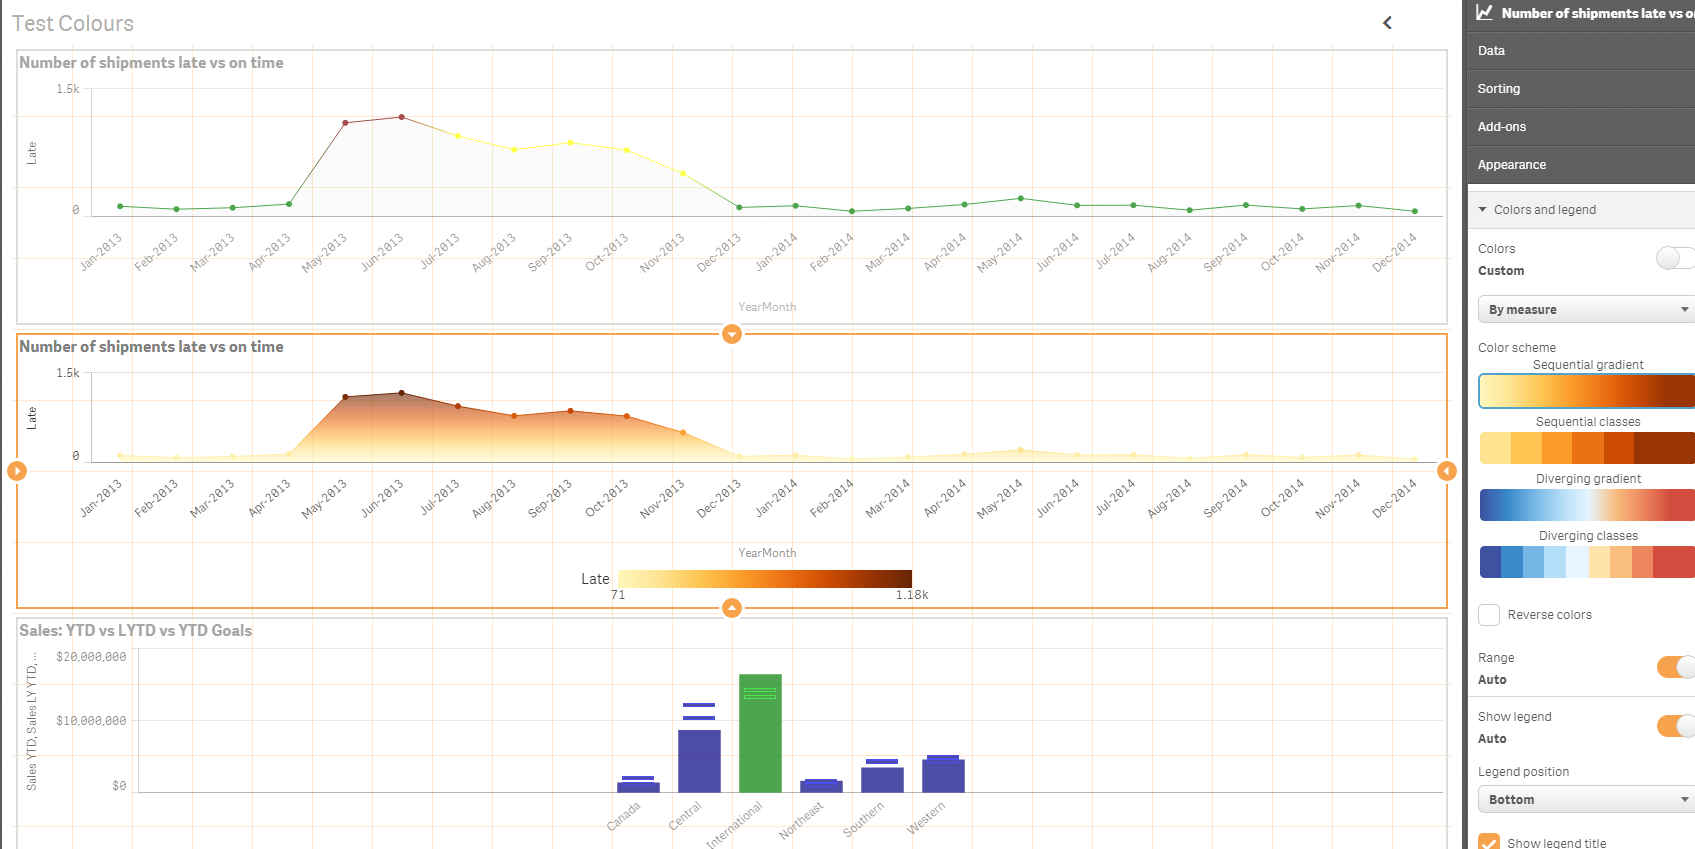
There is no way of custom colouring the fill area under a line chart using an expression, you can change the line but that's it.
There are a couple of default colour schemes you cannot change and a min/max range you can play with under the custom colours by measure option however they are not customisable enough for you to achieve what you listed above. The default for area colour by expression is a light grey.
Thanks.
- Mark as New
- Bookmark
- Subscribe
- Mute
- Subscribe to RSS Feed
- Permalink
- Report Inappropriate Content
Hi Phil,
thanks for your reply. Too bad, then I will have to fiddle arround with difference graphs 😉
- Mark as New
- Bookmark
- Subscribe
- Mute
- Subscribe to RSS Feed
- Permalink
- Report Inappropriate Content
Hi David,
I get the same result as you (line is coloured, not the area).
Other options could be either colouring by Measure (not too customisable but the idea is there) or if you want specific colours as in your dashboard, to (as you suggested) use another chart (i.e. like the bar chart I have below).