Unlock a world of possibilities! Login now and discover the exclusive benefits awaiting you.
- Qlik Community
- :
- Forums
- :
- Analytics
- :
- New to Qlik Analytics
- :
- Dimensions based on Total and Aggr
- Subscribe to RSS Feed
- Mark Topic as New
- Mark Topic as Read
- Float this Topic for Current User
- Bookmark
- Subscribe
- Mute
- Printer Friendly Page
- Mark as New
- Bookmark
- Subscribe
- Mute
- Subscribe to RSS Feed
- Permalink
- Report Inappropriate Content
Dimensions based on Total and Aggr
Hi,
I am trying to create a table / bar chart in the UI that shows Sales by a dimension built in the UI.
The dimension is meant to categorize sales by both customer and year: below 50,000 will get group 'A', other wise 'B'.
For ex: customer no. 1 with sales of 10,000 in 2017 will be in group A, while the same customer in 2018 with 60,000 will be in group B.
However, whenever I select "A", i get both 'A' AND 'B', and visa versa.
I also need the Formula to allow use of Set Analysis.
What is wrong here?
=AGGR(IF(sum({<DataBase={'Customer Orders'}>} TOTAL <CustomerID,Year> Amount) < 50000,'A','B'),CustomerID,Year)
Thank you,
Sandra
- « Previous Replies
-
- 1
- 2
- Next Replies »
- Mark as New
- Bookmark
- Subscribe
- Mute
- Subscribe to RSS Feed
- Permalink
- Report Inappropriate Content
Try this
=Aggr(If(Sum({<DataBase={'Customer Orders'}, CustomerID, Year>} Amount) < 50000,'A','B'), CustomerID, Year)
- Mark as New
- Bookmark
- Subscribe
- Mute
- Subscribe to RSS Feed
- Permalink
- Report Inappropriate Content
thanks but same problem still
- Mark as New
- Bookmark
- Subscribe
- Mute
- Subscribe to RSS Feed
- Permalink
- Report Inappropriate Content
How about if you use this?
=Aggr(If(Sum({1<DataBase={'Customer Orders'}>} Amount) < 50000,'A','B'), CustomerID, Year)
- Mark as New
- Bookmark
- Subscribe
- Mute
- Subscribe to RSS Feed
- Permalink
- Report Inappropriate Content
Thanks again bur still not showing good filter.
I would add a print screen here if I new how..
Sandra
- Mark as New
- Bookmark
- Subscribe
- Mute
- Subscribe to RSS Feed
- Permalink
- Report Inappropriate Content
- Mark as New
- Bookmark
- Subscribe
- Mute
- Subscribe to RSS Feed
- Permalink
- Report Inappropriate Content
Thanks!
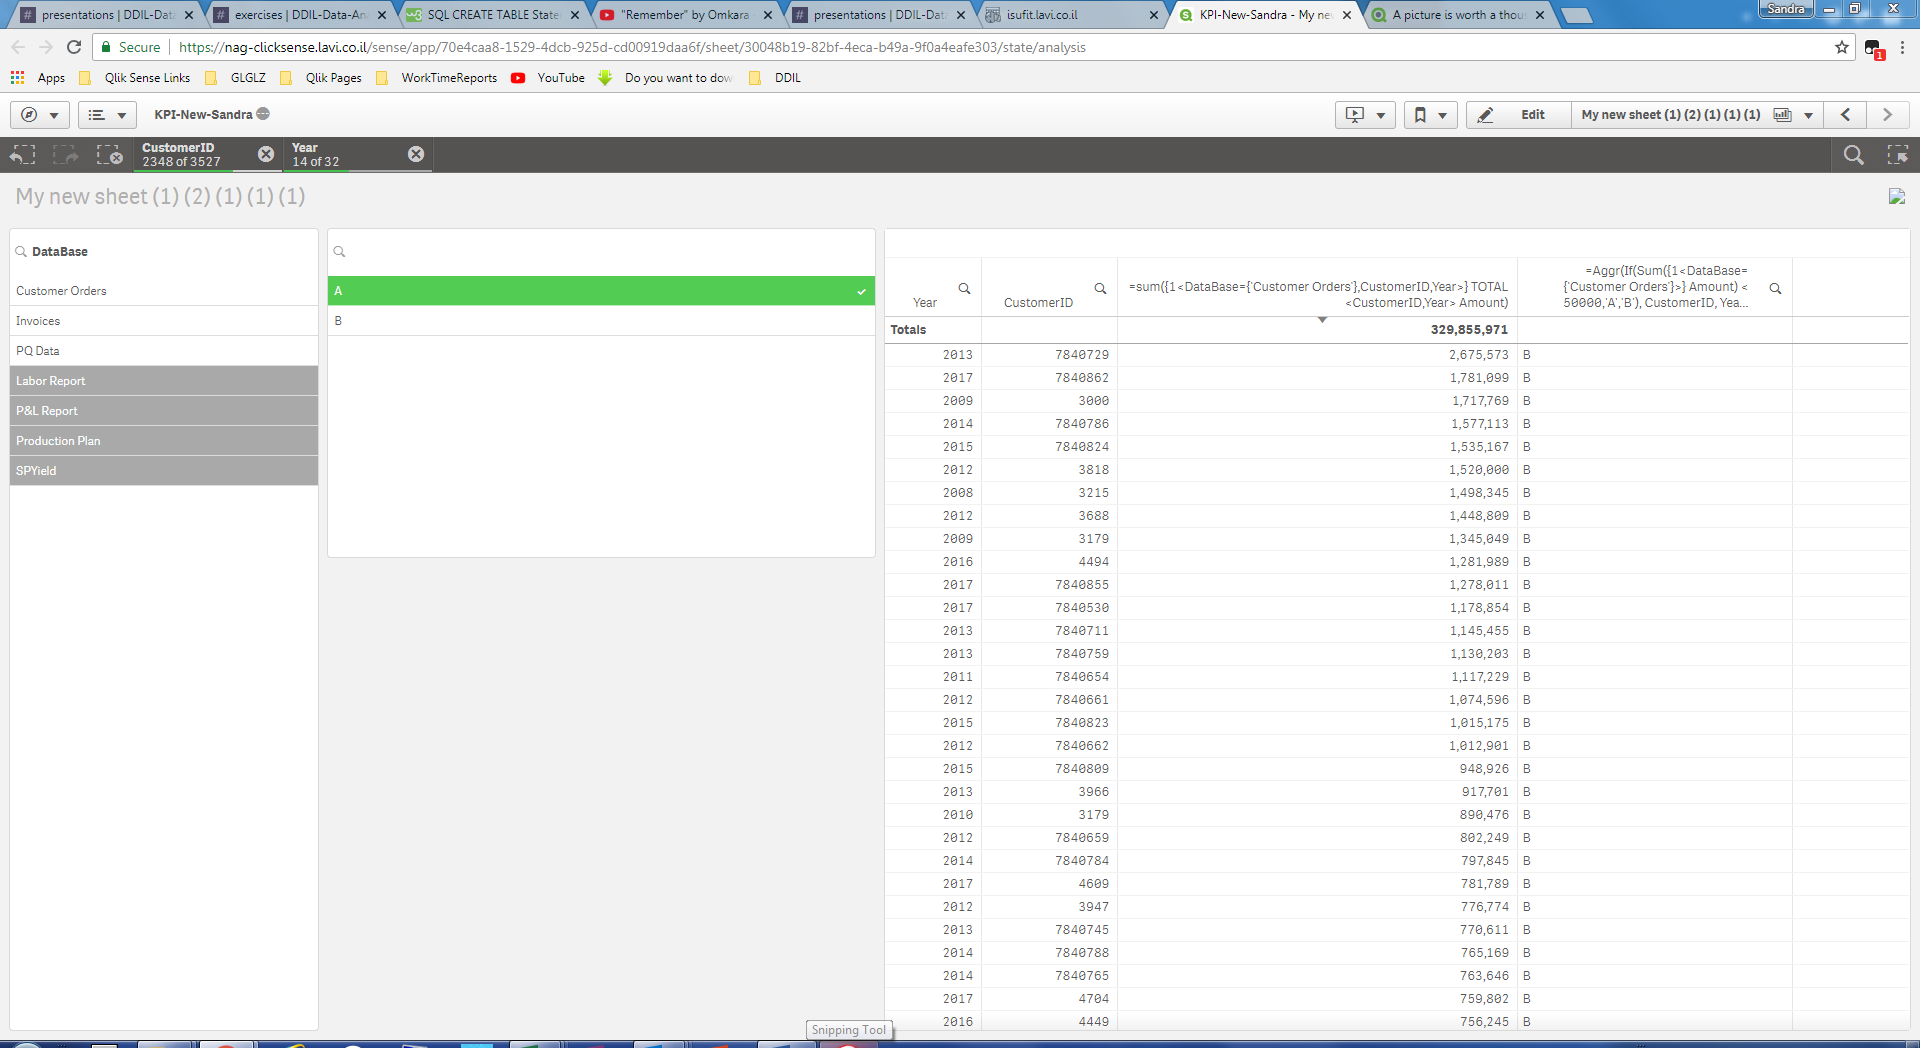
Here is the print screen
I have selected A but still the table shows B as well.
Sandra
- Mark as New
- Bookmark
- Subscribe
- Mute
- Subscribe to RSS Feed
- Permalink
- Report Inappropriate Content
by the way,
if I remove the 1 from the set analysis of the MEASURE, I still get the exact same result
Sandra
- Mark as New
- Bookmark
- Subscribe
- Mute
- Subscribe to RSS Feed
- Permalink
- Report Inappropriate Content
What is the expression for your filter?
- Mark as New
- Bookmark
- Subscribe
- Mute
- Subscribe to RSS Feed
- Permalink
- Report Inappropriate Content
the filter is the same as the Dimenstion column - same expression.
=Aggr(If(Sum({1<DataBase={'Customer Orders'}>} Amount) < 50000,'A','B'), CustomerID, Year)
- « Previous Replies
-
- 1
- 2
- Next Replies »