Unlock a world of possibilities! Login now and discover the exclusive benefits awaiting you.
- Qlik Community
- :
- Forums
- :
- Analytics
- :
- New to Qlik Analytics
- :
- Discrepancy in pivot table values before and after...
- Subscribe to RSS Feed
- Mark Topic as New
- Mark Topic as Read
- Float this Topic for Current User
- Bookmark
- Subscribe
- Mute
- Printer Friendly Page
- Mark as New
- Bookmark
- Subscribe
- Mute
- Subscribe to RSS Feed
- Permalink
- Report Inappropriate Content
Discrepancy in pivot table values before and after filtering
Dear community,
I am encountering a strange issue with my pivot table. You may find the examples below for the incident.
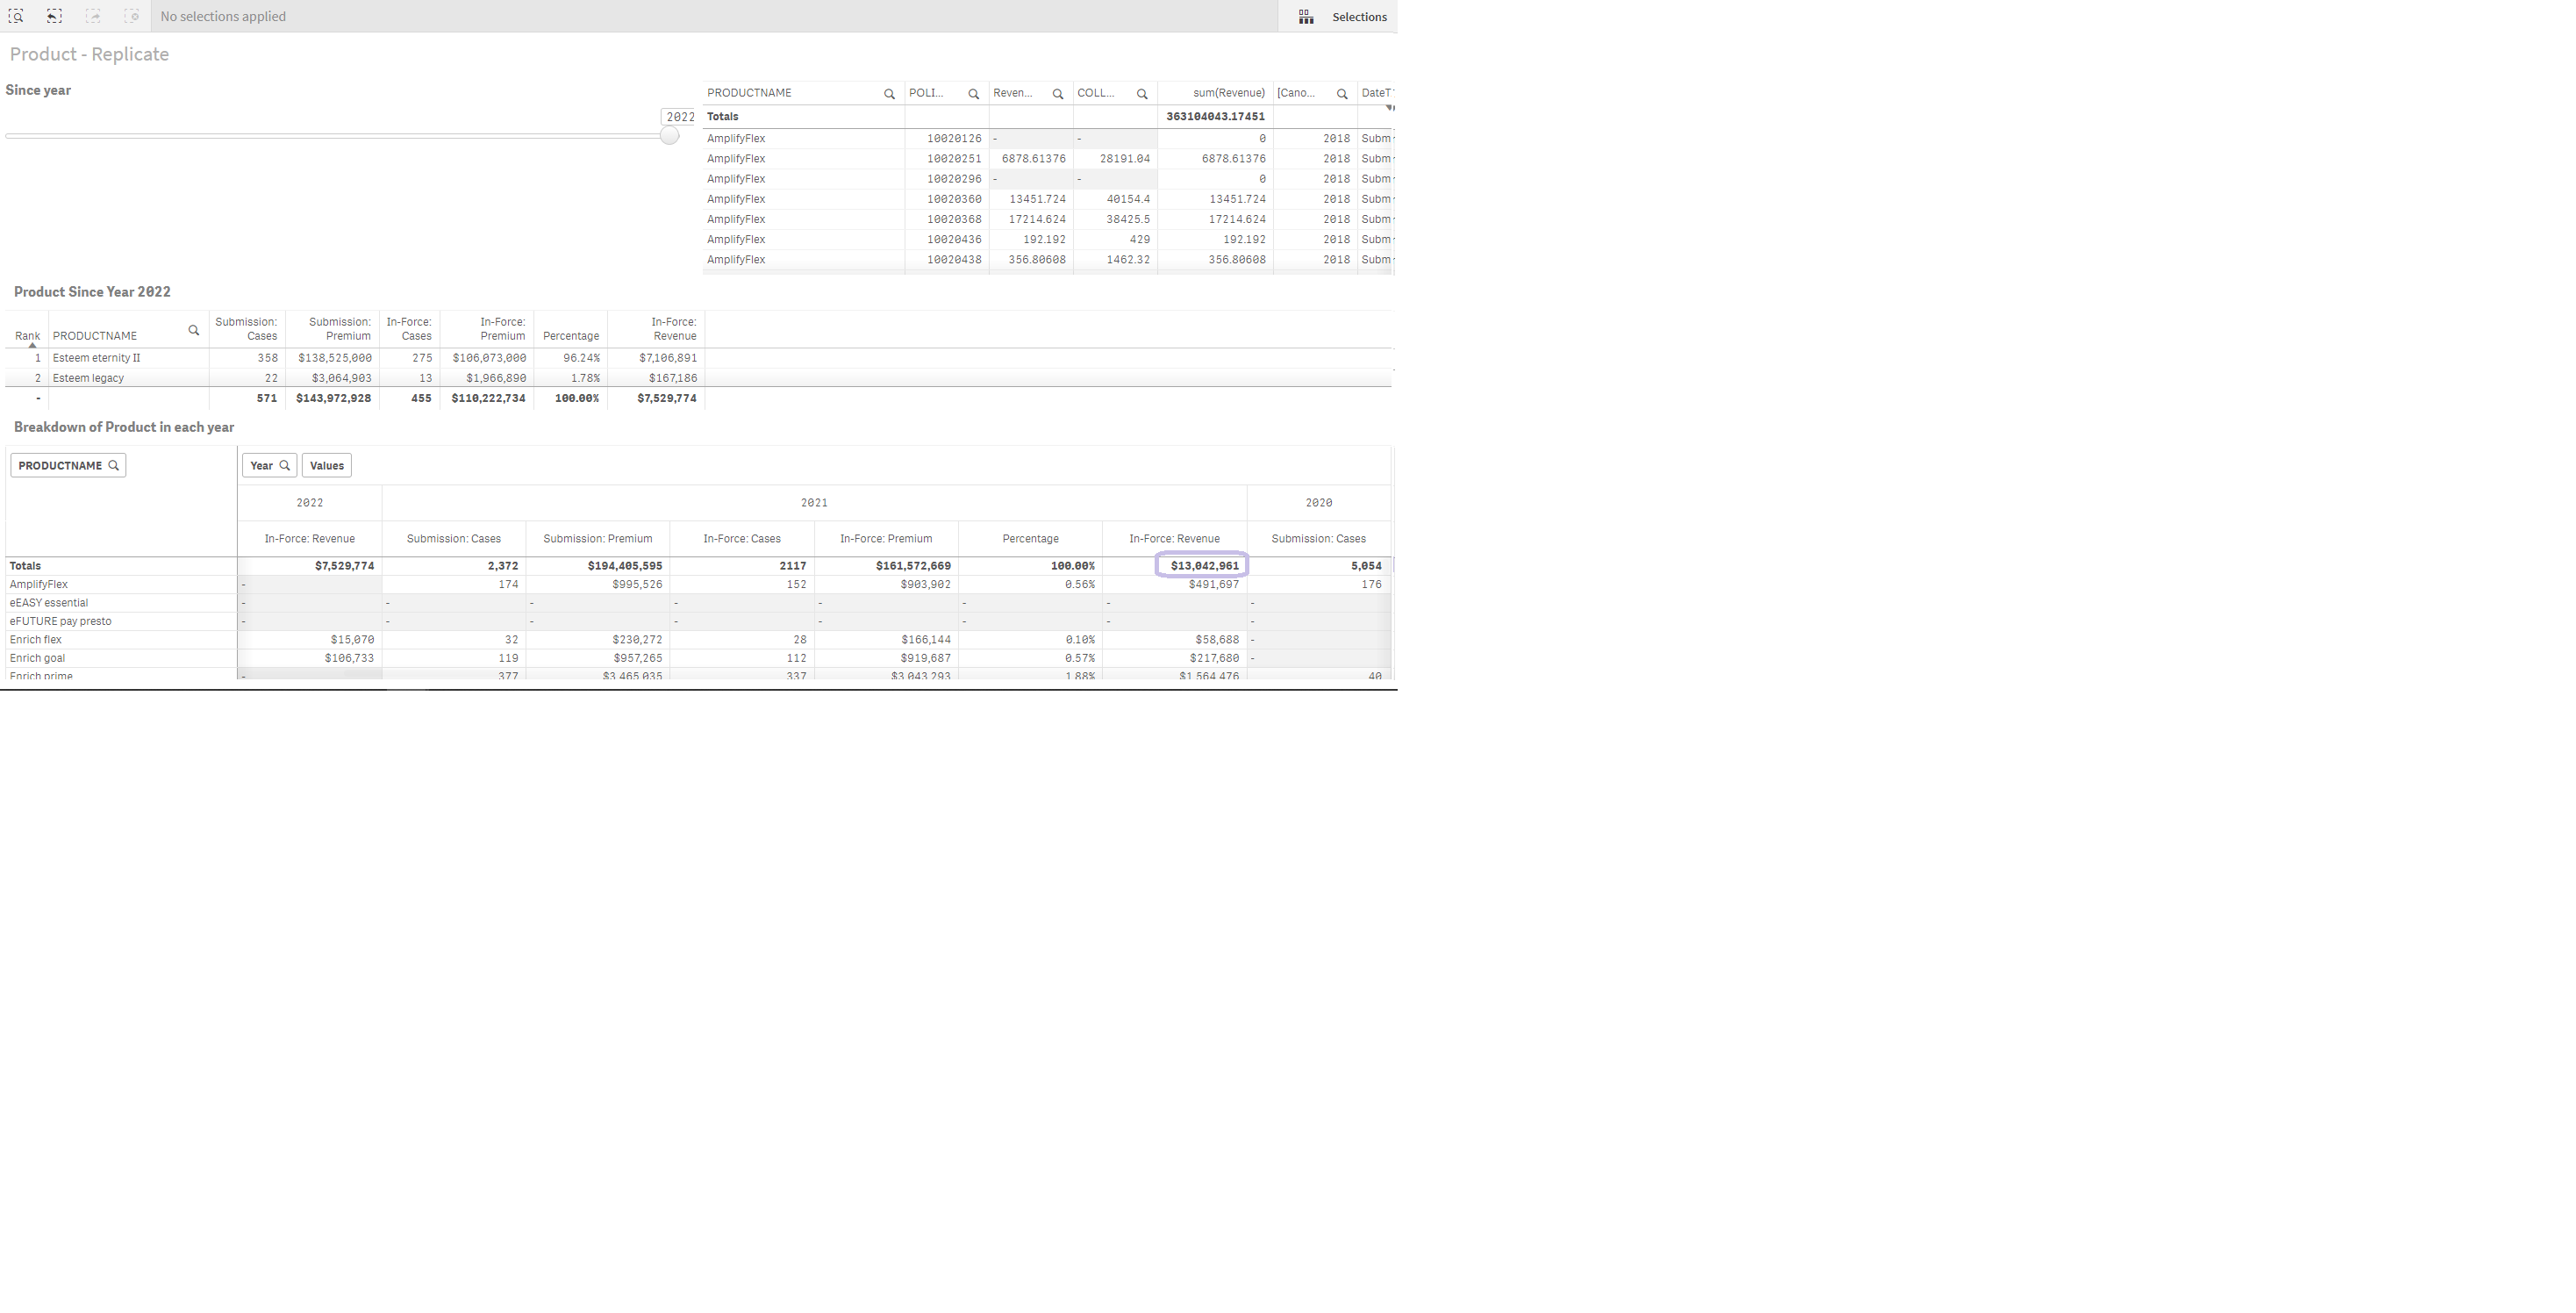
i) I have a pivot table with year(date) on the column while product on the row
ii) I realise that the sum of one of the column is different if I were to have a filter pane on year(date) - before filtering year 2021, the total value for year 2021 (revenue) is 13,042,961; after filtering year 2021, the total value for year 2021 (revenue) is 13,059,796.
You may refer to the screenshot for reference. I would really use your help if this has happened to any of you before. Thank you.
- Tags:
- filter
- pivottable
- Mark as New
- Bookmark
- Subscribe
- Mute
- Subscribe to RSS Feed
- Permalink
- Report Inappropriate Content
I can see from one of the screenshots that you use a canonical date, which implies that you have multiple date fields in your app.
I would start by checking that you really make the selection in the same field as you have in your pivot table. If you have e.g. shipping date in your chart, but make the selection in e.g. order date, you can get exactly this kind of effects.