Unlock a world of possibilities! Login now and discover the exclusive benefits awaiting you.
- Qlik Community
- :
- All Forums
- :
- Visualization and Usability
- :
- Do you create a subset of data using preceding or ...
- Subscribe to RSS Feed
- Mark Topic as New
- Mark Topic as Read
- Float this Topic for Current User
- Bookmark
- Subscribe
- Mute
- Printer Friendly Page
- Mark as New
- Bookmark
- Subscribe
- Mute
- Subscribe to RSS Feed
- Permalink
- Report Inappropriate Content
Do you create a subset of data using preceding or resident load?
Hi,
I'm still very new to this so maybe I'm thinking about this in the wrong way, or maybe I'm just not understanding the syntax or logic needing to be applied to Preceding and/or Resident loading.
My issues is that I have about ~300 rows loaded from an excel sheet that are essentially:
Name | Status_Now | Status_LastMonth | Status_Last2Month
"ABC" "Green" "Amber" "Red"
"DEF" "Green" "Green" "Green"
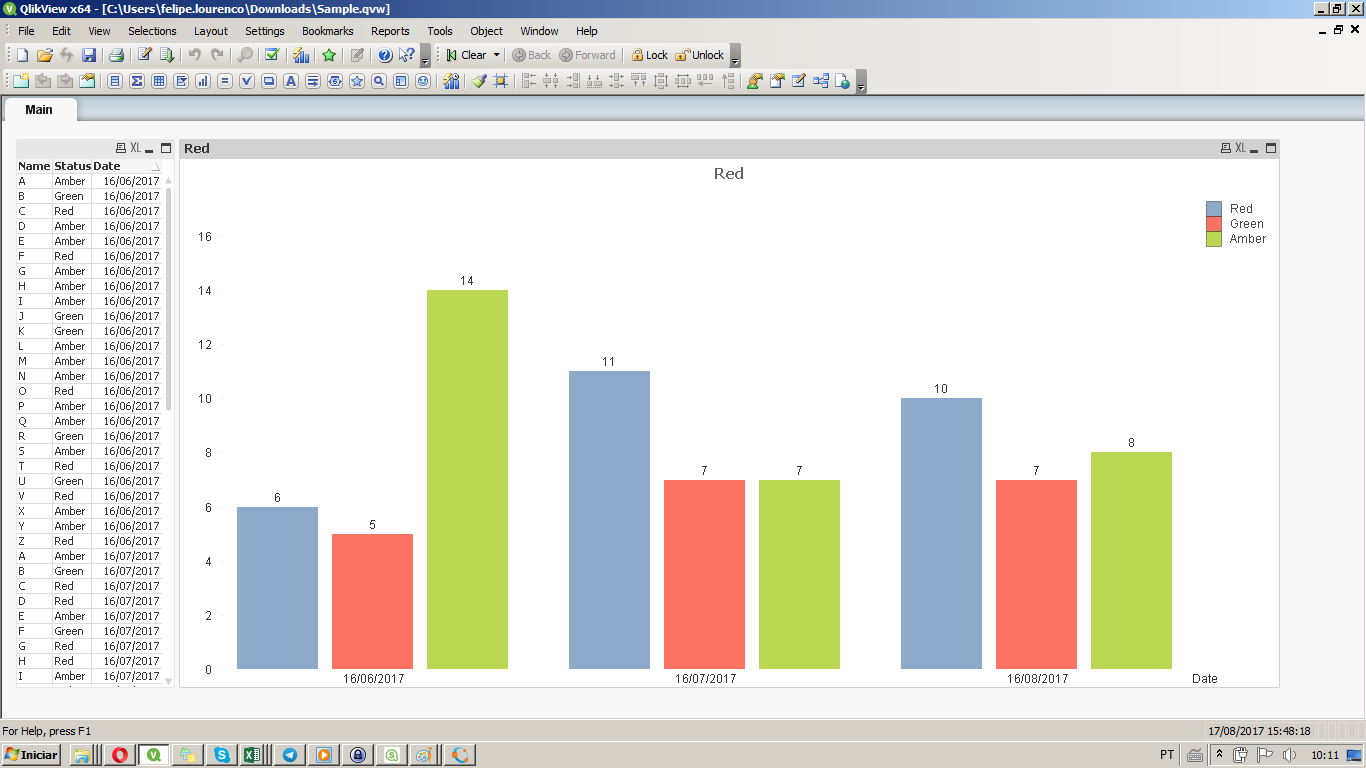
What I'd like to do is manipulate this data so I can show a stacked bar chart of the total number of Green/Amber/Reds over the last 3 months.
Do you do that manipulation via a resident load after the initial load of the excel data?
EDIT: I guess the more pressing concern is how do I make any visualisation dynamically recognise that Status_Now/Status_LastMonth/Status_Last2Month mean Month(Today())/Month(Today())-1/Month(Today())-2, respectively?
Accepted Solutions
- Mark as New
- Bookmark
- Subscribe
- Mute
- Subscribe to RSS Feed
- Permalink
- Report Inappropriate Content
Hi Matthew,
I always assume people have View (my mistake).
Here's the load
SampleData:
LOAD Name,
Status_Now as Status,
Today() as Date
FROM
(ooxml, embedded labels, table is Plan1);
LOAD Name,
Status_LastMonth as Status,
AddMonths(Today(),-1) as Date
FROM
(ooxml, embedded labels, table is Plan1);
LOAD Name,
Status_Last2Month as Status,
AddMonths(Today(),-2) as Date
FROM
(ooxml, embedded labels, table is Plan1);
And for expressions, go with (each is an individual measure):
count({<Status={'Red'}>}Status) // for red count
count({<Status={'Green'}>}Status) // for green coutn
count({<Status={'Amber'}>}Status) // for amber
That gives the following table

- Mark as New
- Bookmark
- Subscribe
- Mute
- Subscribe to RSS Feed
- Permalink
- Report Inappropriate Content
Hi Matthew,
See the attached QVW for an example on how to do it.
About the Resident or precedent load, is up to you really on how to do it because both are similar solutions, in my solution I just loaded the table 3 times with different fields (similar to a Concatenate).
Hope it helps.
Felipe.
- Mark as New
- Bookmark
- Subscribe
- Mute
- Subscribe to RSS Feed
- Permalink
- Report Inappropriate Content
Hi Felip,
Thanks for the response. Unfortunately our QlikSense application is locked down at work and I don't think I can load this QVW application (I only have access to a share where I put data files to import, like excel files). Unless of course I don't know how to do but it is possible.
Would it be possible to post just how you load the table? Sorry for the inconvenience.
Matthew
- Mark as New
- Bookmark
- Subscribe
- Mute
- Subscribe to RSS Feed
- Permalink
- Report Inappropriate Content
Hi Matthew,
I always assume people have View (my mistake).
Here's the load
SampleData:
LOAD Name,
Status_Now as Status,
Today() as Date
FROM
(ooxml, embedded labels, table is Plan1);
LOAD Name,
Status_LastMonth as Status,
AddMonths(Today(),-1) as Date
FROM
(ooxml, embedded labels, table is Plan1);
LOAD Name,
Status_Last2Month as Status,
AddMonths(Today(),-2) as Date
FROM
(ooxml, embedded labels, table is Plan1);
And for expressions, go with (each is an individual measure):
count({<Status={'Red'}>}Status) // for red count
count({<Status={'Green'}>}Status) // for green coutn
count({<Status={'Amber'}>}Status) // for amber
That gives the following table

- Mark as New
- Bookmark
- Subscribe
- Mute
- Subscribe to RSS Feed
- Permalink
- Report Inappropriate Content
Hi Felip,
This worked perfectly! I apologise for not saying something sooner. I thought I had responded and I didn't This has worked wonders for me and also given me a good idea of how to structure the data in the load editor. Thank you!
Matthew