Unlock a world of possibilities! Login now and discover the exclusive benefits awaiting you.
- Qlik Community
- :
- Forums
- :
- Analytics
- :
- New to Qlik Analytics
- :
- Re: Exporting with filter
- Subscribe to RSS Feed
- Mark Topic as New
- Mark Topic as Read
- Float this Topic for Current User
- Bookmark
- Subscribe
- Mute
- Printer Friendly Page
- Mark as New
- Bookmark
- Subscribe
- Mute
- Subscribe to RSS Feed
- Permalink
- Report Inappropriate Content
Exporting with filter
Hello everybody, hope you are fine ![]()
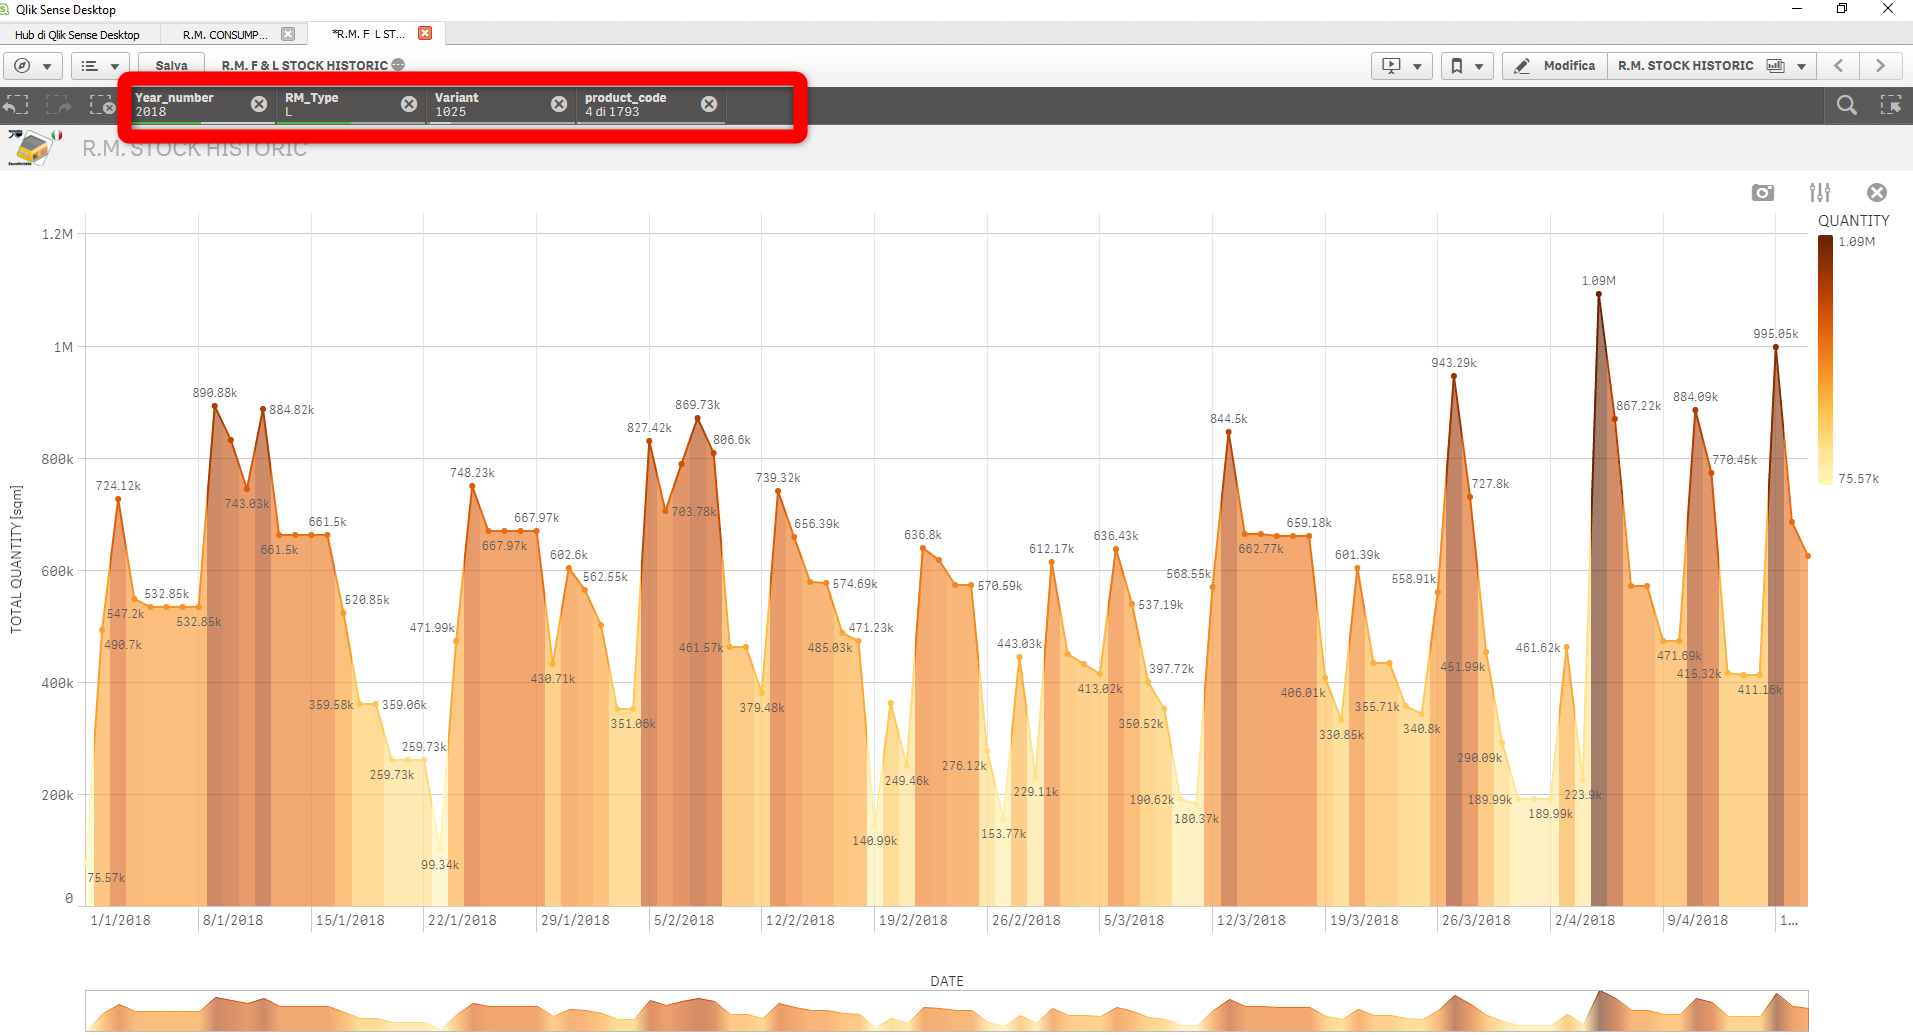
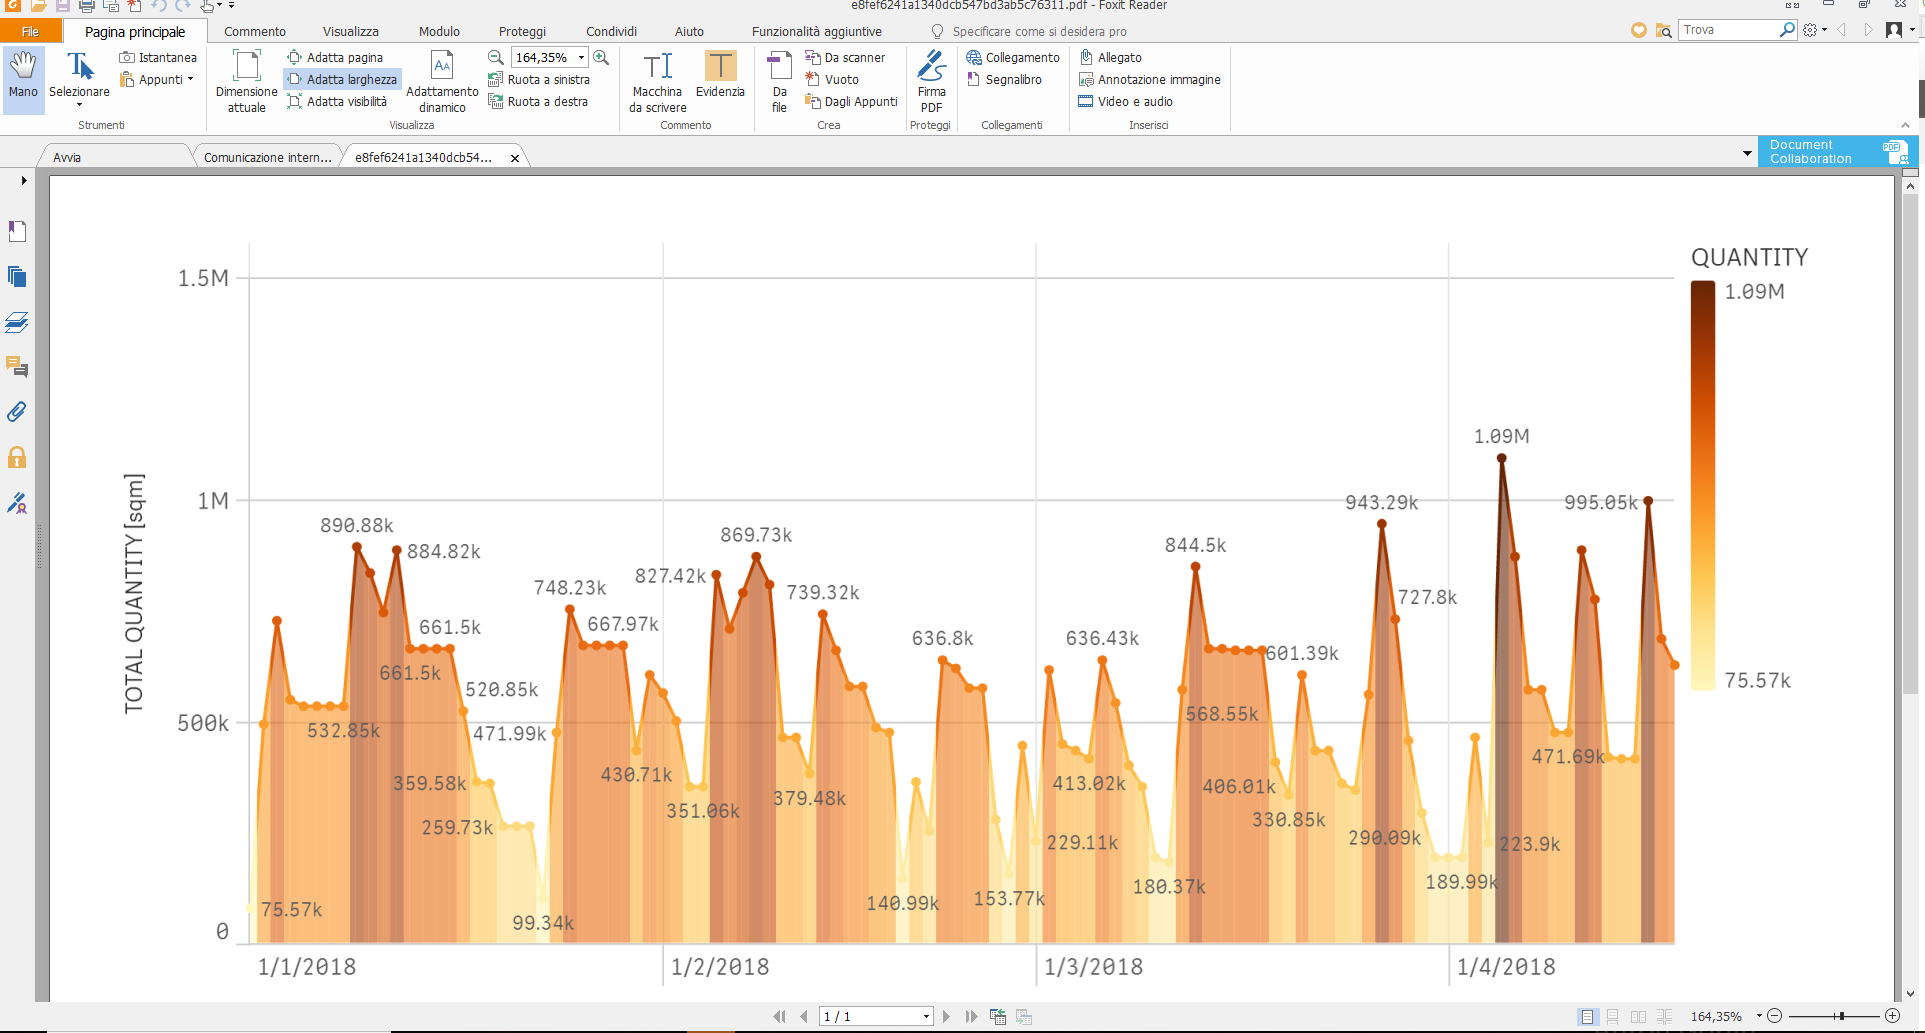
I am using Qlick sense Desktop , In Qlik is there a possibility to see the filtered data on the graph? I mean when you are filtering there is a bar on the top shows the filtered items and bellow the information or the graph are shown according to the filters, once you want to export the the graph nobody knows what the graph is about , I want to show the filtered infrmartion in a label show in the graph while exporting the graph in the PDF, you can see the pictues to better underestand. Thanks


- « Previous Replies
- Next Replies »
Accepted Solutions
- Mark as New
- Bookmark
- Subscribe
- Mute
- Subscribe to RSS Feed
- Permalink
- Report Inappropriate Content
Hi,
under, Aspect, general, title, you can try this:
=GetCurrentSelections()
- Mark as New
- Bookmark
- Subscribe
- Mute
- Subscribe to RSS Feed
- Permalink
- Report Inappropriate Content
Hi,
under, Aspect, general, title, you can try this:
=GetCurrentSelections()
- Mark as New
- Bookmark
- Subscribe
- Mute
- Subscribe to RSS Feed
- Permalink
- Report Inappropriate Content
Thanks buddy ![]()
- Mark as New
- Bookmark
- Subscribe
- Mute
- Subscribe to RSS Feed
- Permalink
- Report Inappropriate Content
You're welcome, good luck ![]()
- Mark as New
- Bookmark
- Subscribe
- Mute
- Subscribe to RSS Feed
- Permalink
- Report Inappropriate Content
dude, what if i want to show specific title instead of showing what is selected, i mean , Imagine the title selected is PRODUCTION and i want to show only PDT, is it possible with this function ? i know in SQL we can do that simply by saying (as PDT), but i just want to know if it is possible in qlik, Thanks
- Mark as New
- Bookmark
- Subscribe
- Mute
- Subscribe to RSS Feed
- Permalink
- Report Inappropriate Content
If you have a field named PRODUCTION, you want to display it everywhere as PDT or just on this chart ?
- Mark as New
- Bookmark
- Subscribe
- Mute
- Subscribe to RSS Feed
- Permalink
- Report Inappropriate Content
i want it on this chart, I mean , t want to set different names for different fields to display.
and what about if i want to show different names for different fields on the sama chart , like; Production to PDT, Month to Mth and so on --
- Mark as New
- Bookmark
- Subscribe
- Mute
- Subscribe to RSS Feed
- Permalink
- Report Inappropriate Content
it will be a lot of efforts for each object, but something like this would be interesting :
=pick(match(GetCurrentSelections(),'*Production*','*Month*'),'PDT','Mth') and so on
give it a try
- Mark as New
- Bookmark
- Subscribe
- Mute
- Subscribe to RSS Feed
- Permalink
- Report Inappropriate Content
Thanks , I tried, No luck!
- Mark as New
- Bookmark
- Subscribe
- Mute
- Subscribe to RSS Feed
- Permalink
- Report Inappropriate Content
I'll get back to you with a QVF
- « Previous Replies
- Next Replies »