Unlock a world of possibilities! Login now and discover the exclusive benefits awaiting you.
- Qlik Community
- :
- Forums
- :
- Analytics
- :
- New to Qlik Analytics
- :
- Re: Expression for IF more than and drill down
- Subscribe to RSS Feed
- Mark Topic as New
- Mark Topic as Read
- Float this Topic for Current User
- Bookmark
- Subscribe
- Mute
- Printer Friendly Page
- Mark as New
- Bookmark
- Subscribe
- Mute
- Subscribe to RSS Feed
- Permalink
- Report Inappropriate Content
Expression for IF more than and drill down
Dear all
I am new to Qlik and is struggling to understand and use codes and know where to place codes.
Could someone please please help me with the two questions.
I am working on a movie database that has columns called MovieTitle and Ratings.
I need to show the following two items in my dashboard:
1) List only movies that received at least 1000 ratings.
2) Of those, list only movies that got ratings of 4.3 or higher.
For (1), I have created a List Table and set my Dimension as MovieTitle. I am trying to set an Expression to calculate the total Ratings for each MovieTitle and get my List Table to display only MovieTitle that have a Rating score of 1000 and above. I am struggling to understand the IF statement and brackets, etc. How do I get my List Table to display this set of information?
For (2), I need to use the results from the List Table in (1) above and further drill down to display only MovieTitle that received an AverageRating of 4.3 and above. I know how to calculate Average Rating using Avg (Rating) in my Expression.
I will appreciate any help you can give.
Many thanks
Accepted Solutions
- Mark as New
- Bookmark
- Subscribe
- Mute
- Subscribe to RSS Feed
- Permalink
- Report Inappropriate Content
Hi Jess,
In your chart's sort section, try to promote (Filter) column and then sort is in ascending/descending accordingly, also
remove the tick from Allow interactive sort.
It should work then.
It's my kind suggestion, just go through once the basic functionalities of all the charts sections and section access thing, so that you will better not get stuck in such issue in future.
Please, mark it as correct if it helps so that we can close this call.
Thank you.
Regards,
Alkis
- Mark as New
- Bookmark
- Subscribe
- Mute
- Subscribe to RSS Feed
- Permalink
- Report Inappropriate Content
Can you provide examples?
Is it possible to do your calculations in the script and then eliminate what you don't want to see in a Where clause?
If not, it would be helpful to see what you are doing and an example of the real data.
- Mark as New
- Bookmark
- Subscribe
- Mute
- Subscribe to RSS Feed
- Permalink
- Report Inappropriate Content
Hi Jess,
In your list table -> in expression -> you can write it as
For 1) =if(Aggr(count(ratings),MovieName)>='1000',MovieName)
For 2) you can further use same expression with and condition as follows,
=if(Aggr(count(ratings),MovieName)>='1000' and Aggr(Avg(ratings),MovieName)>='4.3',MovieName)
This will only display the desired movie names in list box or you can use same expression in any chart also.
You just need to modify it accordingly.
Hope this will help.
Please, mark it as correct if it helps so that we can close this call.
Thank you.
Regards,
Alkis
- Mark as New
- Bookmark
- Subscribe
- Mute
- Subscribe to RSS Feed
- Permalink
- Report Inappropriate Content
Thank you all for responding so quickly.
Hi Alkis
I inserted the first code into my List Box Expression but weird data is displayed.
I've extracted a small sample data from two different Excel files to give you an idea of the dataset used.
Each User can rate more than one movie.
Each movie can be rated by many Users.
The MovieID is unique.
I need to sum the Rating of a movie to get the total ratings for that movie.
My dashboard table should only display MovieGenres.Title (or movie titles) that have a total rating score of 1,000 and above.
From that data, I need to another table to list only movies that got ratings of 4.3 or higher.
For Ques 1)
Here is my code used for a List Box under Expression.
(Aggr(count(Rating),MovieGenres.Title)>='1000',MovieGenres.Title)
I also tried this:
(Aggr(sum(Rating),MovieGenres.Title)>='1000',MovieGenres.Title)
I also tried a Pivot Table with Dimension as MovieGenres.Title and the Expression as above.
I get a blank table too.
I'm not sure why it's showing be blanks or categories that are not relevant to the code.
What am I doing wrong? 
Many thanks
| UserID | MovieID | Rating | MovieGenres.Title | |||
| 1 | 1193 | 5 | Toy Story (1995) | |||
| 1 | 661 | 3 | Jumanji (1995) | |||
| 1 | 914 | 3 | Grumpier Old Men (1995) | |||
| 2 | 3408 | 4 | Waiting to Exhale (1995) | |||
| 2 | 2355 | 5 | Father of the Bride Part II (1995) | |||
| 2 | 1197 | 3 | Heat (1995) | |||
| 3 | 1287 | 5 | Sabrina (1995) | |||
| 3 | 2804 | 5 | Tom and Huck (1995) | |||
| 3 | 594 | 4 | Sudden Death (1995) | |||
| 4 | 919 | 4 | GoldenEye (1995) | |||
| 4 | 595 | 5 | American PresidentThe (1995) | |||
| 5 | 938 | 4 | Dracula: Dead and Loving It (1995) | |||
| 7 | 2398 | 4 | Balto (1995) | |||
| 7 | 2918 | 4 | Nixon (1995) | |||
| 7 | 1035 | 5 | Cutthroat Island (1995) | |||
| 8 | 2791 | 4 | Casino (1995) | |||
| 8 | 2687 | 3 | Sense and Sensibility (1995) | |||
| 9 | 2018 | 4 | Four Rooms (1995) | |||
| 10 | 3105 | 5 | Ace Ventura: When Nature Calls (1995) | |||
- Mark as New
- Bookmark
- Subscribe
- Mute
- Subscribe to RSS Feed
- Permalink
- Report Inappropriate Content
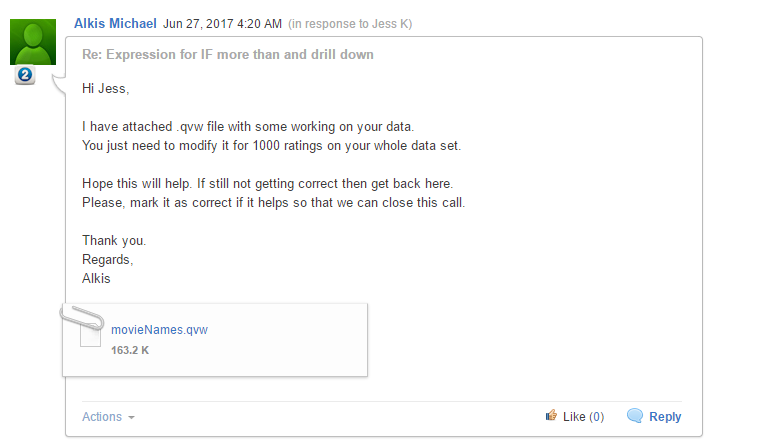
Hi Jess,
I have attached .qvw file with some working on your data.
You just need to modify it for 1000 ratings on your whole data set.
Hope this will help. If still not getting correct then get back here.
Please, mark it as correct if it helps so that we can close this call.
Thank you.
Regards,
Alkis
- Mark as New
- Bookmark
- Subscribe
- Mute
- Subscribe to RSS Feed
- Permalink
- Report Inappropriate Content
Thank you Alkis
I don't see any file attached?
- Mark as New
- Bookmark
- Subscribe
- Mute
- Subscribe to RSS Feed
- Permalink
- Report Inappropriate Content
Hi jess,
It should be there. See the screen snap.
If you still unable to find it then let me know. Will find some another way.
- Mark as New
- Bookmark
- Subscribe
- Mute
- Subscribe to RSS Feed
- Permalink
- Report Inappropriate Content
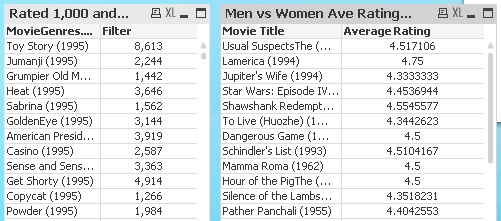
Alkis! I've managed to get the tables done! I have learnt alot...you're a STAR
The only thing I can't do is to sort the number values by ascending order, from larger to smaller.
See my tables below. I went to the SORT tab and chose the Expression and placed a Numeric Ascending order setting, but nothing happens. See image below.
Why isn't it sorting my numbers?
I'm using Personal Edition and can't open any other files.
Thank you!
- Mark as New
- Bookmark
- Subscribe
- Mute
- Subscribe to RSS Feed
- Permalink
- Report Inappropriate Content
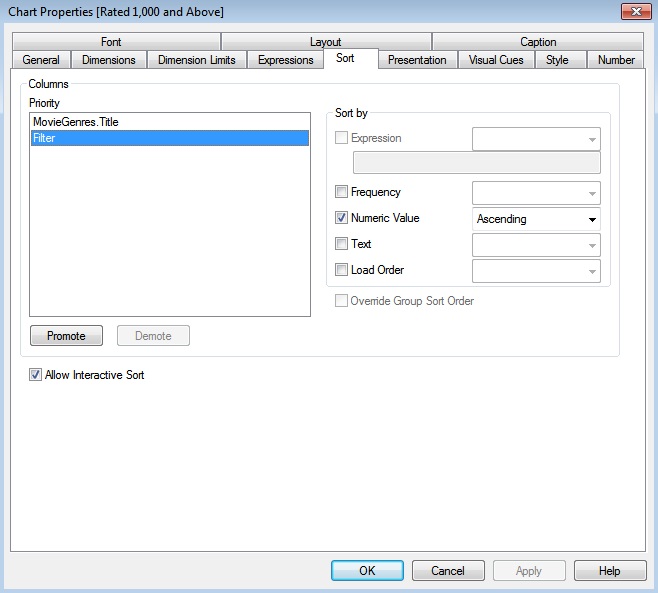
Hi Jess,
In your chart's sort section, try to promote (Filter) column and then sort is in ascending/descending accordingly, also
remove the tick from Allow interactive sort.
It should work then.
It's my kind suggestion, just go through once the basic functionalities of all the charts sections and section access thing, so that you will better not get stuck in such issue in future.
Please, mark it as correct if it helps so that we can close this call.
Thank you.
Regards,
Alkis
- Mark as New
- Bookmark
- Subscribe
- Mute
- Subscribe to RSS Feed
- Permalink
- Report Inappropriate Content
It worked like a jem Alkis.
Thank you so much