Unlock a world of possibilities! Login now and discover the exclusive benefits awaiting you.
- Qlik Community
- :
- Forums
- :
- Analytics
- :
- New to Qlik Analytics
- :
- Re: Filtering out data
- Subscribe to RSS Feed
- Mark Topic as New
- Mark Topic as Read
- Float this Topic for Current User
- Bookmark
- Subscribe
- Mute
- Printer Friendly Page
- Mark as New
- Bookmark
- Subscribe
- Mute
- Subscribe to RSS Feed
- Permalink
- Report Inappropriate Content
Filtering out data
Dear all
I am working with the following data and is required to list the genres of movies that Lawyers liked the most (based on Rating).
I need to create a bar chart to list the Title and the Total Rating (only ratings by Lawyers and exclude all other occupation).
What codes do I place in my expression to calculate the total ratings of lawyers only?
Thank you!
| MovieID | Title | Rating | Genres | UserID | Gender | Occupation |
| 1 | Toy Story (1995) | 5 | Animation | 719 | M | Lawyer |
| 2 | Jumanji (1995) | 4 | Adventure | 1056 | M | Student |
| 3 | Grumpier Old Men (1995) | 4 | Comedy | 1187 | F | Lawyer |
| 4 | Waiting to Exhale (1995) | 5 | Comedy | 1200 | M | Lawyer |
| 5 | Father of the Bride Part II (1995) | 5 | Comedy | 1296 | M | Lawyer |
| 6 | Heat (1995) | 4 | Action | 1458 | M | Teacher |
| 7 | Sabrina (1995) | 5 | Comedy | 1509 | M | Lawyer |
| 8 | Tom and Huck (1995) | 3 | Children's | 1573 | M | Student |
| 9 | Sudden Death (1995) | 4 | Action | 1919 | M | Lawyer |
| 10 | GoldenEye (1995) | 3 | Action | 1926 | F | Lawyer |
| 11 | American PresidentThe (1995) | 3 | Drama | 2045 | F | Teacher |
| 12 | Dracula: Dead and Loving It (1995) | 5 | Horror | 2120 | M | Student |
| 13 | Balto (1995) | 5 | Children's | 2169 | M | Student |
| 14 | Nixon (1995) | 5 | Drama | 3234 | F | Lawyer |
| 15 | Cutthroat Island (1995) | 5 | Action | 3594 | M | Lawyer |
| 16 | Casino (1995) | 4 | Thriller | 3780 | M | Lawyer |
| 17 | Sense and Sensibility (1995) | 4 | Drama | 4633 | M | Lawyer |
| 18 | Four Rooms (1995) | 5 | Thriller | 4707 | M | Teacher |
| 19 | Ace Ventura: When Nature Calls (1995) | 5 | Comedy | 5074 | M | Lawyer |
- « Previous Replies
-
- 1
- 2
- Next Replies »
- Mark as New
- Bookmark
- Subscribe
- Mute
- Subscribe to RSS Feed
- Permalink
- Report Inappropriate Content
Sure, use Sum... I guess the point Felip was trying to get across was the fact that to get Sum or Avg of just one type of Occupation, you need to use set analysis like this
{<OccGroup={"Lawyer"}>}
But ya, if Sum is what you need, then Sum it is 
- Mark as New
- Bookmark
- Subscribe
- Mute
- Subscribe to RSS Feed
- Permalink
- Report Inappropriate Content
I'm a total doofus with this.
Good news is the chart works!
Thank you Felip and Sunny
- Mark as New
- Bookmark
- Subscribe
- Mute
- Subscribe to RSS Feed
- Permalink
- Report Inappropriate Content
Hi Sunny
If you have the time, could you please help with this question.
Listing top 10 and comparison by gender
Thank you!
- Mark as New
- Bookmark
- Subscribe
- Mute
- Subscribe to RSS Feed
- Permalink
- Report Inappropriate Content
hi Jess, how u want do the visualization of the bar chart, like this: in the top are the bar char for all the ocupations and the botton just fot lawyers, with this expression in the measure. sum({<Occupation={"Lawyer"}>}Rating) in order to have raiting avg the express would be avg ({<Occupation={"Lawyer"}>}Rating)
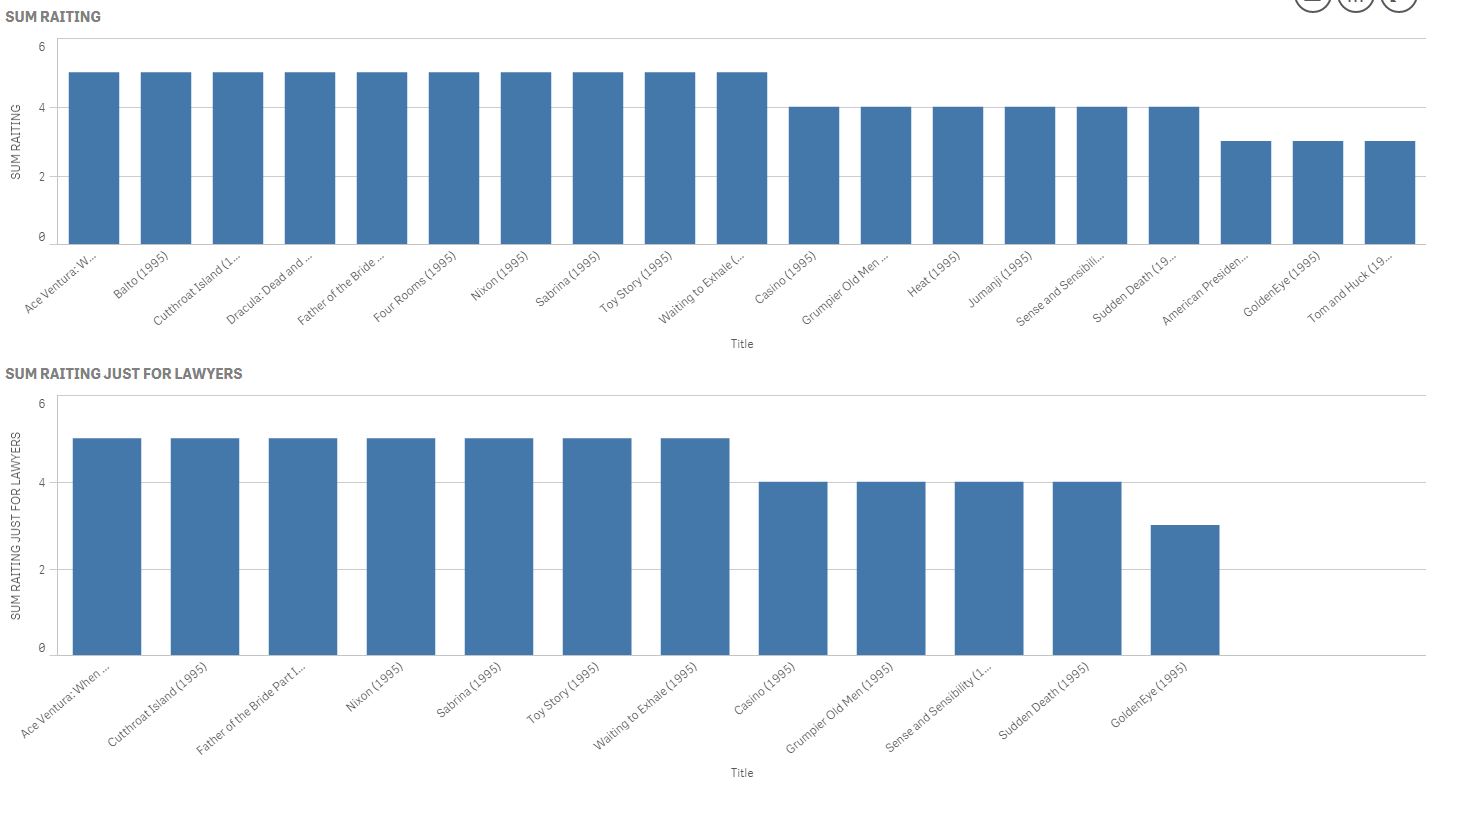
i hope i cant help u, let me know about it.
- « Previous Replies
-
- 1
- 2
- Next Replies »