Unlock a world of possibilities! Login now and discover the exclusive benefits awaiting you.
- Qlik Community
- :
- All Forums
- :
- Visualization and Usability
- :
- Font Size and Graphics Size
- Subscribe to RSS Feed
- Mark Topic as New
- Mark Topic as Read
- Float this Topic for Current User
- Bookmark
- Subscribe
- Mute
- Printer Friendly Page
- Mark as New
- Bookmark
- Subscribe
- Mute
- Subscribe to RSS Feed
- Permalink
- Report Inappropriate Content
Font Size and Graphics Size
Good morning
I've been using Qliksense for some time, very easy and intuitive
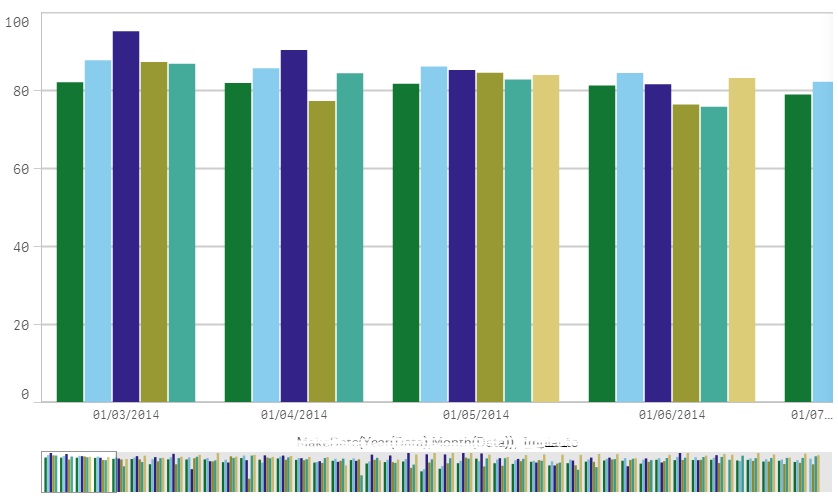
There is, however, a problem when there is a lot of data, for example in X-axis charts, or in selection lists
In this case it is difficult to see many data, it is necessary to make a very long slurry, or make many pages when only one is enough.
Is it not possible to reduce the size of the fonts used, maybe there are additional plugins ??
thanks
- Mark as New
- Bookmark
- Subscribe
- Mute
- Subscribe to RSS Feed
- Permalink
- Report Inappropriate Content
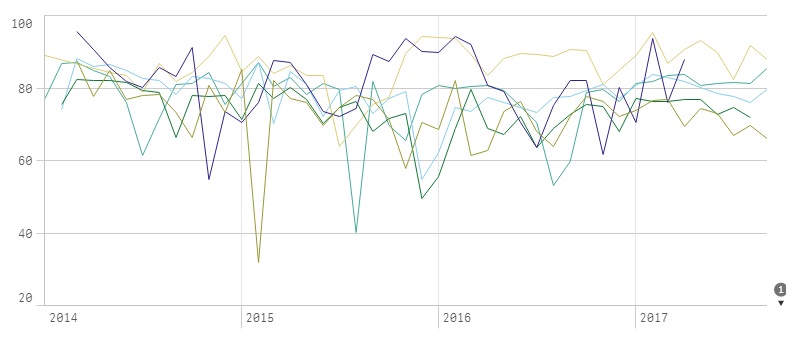
I gained a lot of legibility improvement simply by changing the type of graph, from bar chart to line chart (data are monthly, for five years)

- Mark as New
- Bookmark
- Subscribe
- Mute
- Subscribe to RSS Feed
- Permalink
- Report Inappropriate Content
And I have also a lot of data to be graphed with daily frequency, much more data, this is my problem...