Unlock a world of possibilities! Login now and discover the exclusive benefits awaiting you.
Woohoo! Qlik Community has won “Best in Class Community” in the 2024
Khoros Kudos awards!
Announcements
Nov. 20th, Qlik Insider - Lakehouses: Driving the Future of Data & AI - PICK A SESSION
- Qlik Community
- :
- Forums
- :
- Analytics
- :
- New to Qlik Analytics
- :
- Format get changed.
Options
- Subscribe to RSS Feed
- Mark Topic as New
- Mark Topic as Read
- Float this Topic for Current User
- Bookmark
- Subscribe
- Mute
- Printer Friendly Page
Turn on suggestions
Auto-suggest helps you quickly narrow down your search results by suggesting possible matches as you type.
Showing results for
Creator
2016-08-26
06:51 AM
- Mark as New
- Bookmark
- Subscribe
- Mute
- Subscribe to RSS Feed
- Permalink
- Report Inappropriate Content
Format get changed.
Hi All,
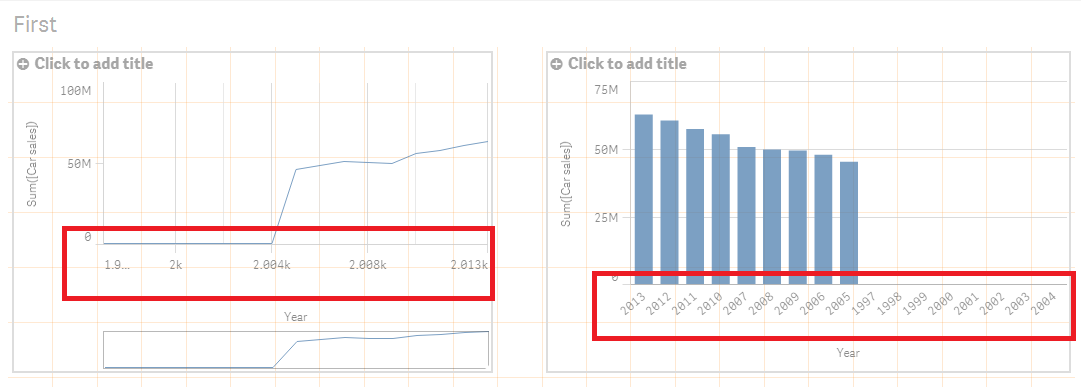
I am very new in QlikSense. I created 2 charts one Bar and Second Line with the same Dimension and Expression in both charts.
But after creating the charts I found X-axis format get changed automatically in line chart. Bar chart is showing the correct format. Can any one help me to find the same format in Line chart what I am getting in Bar Chart.
See Below Image:

Thanks.
392 Views
1 Solution
Accepted Solutions
Master III
2016-08-26
06:58 AM
- Mark as New
- Bookmark
- Subscribe
- Mute
- Subscribe to RSS Feed
- Permalink
- Report Inappropriate Content
341 Views
3 Replies
Master III
2016-08-26
06:58 AM
- Mark as New
- Bookmark
- Subscribe
- Mute
- Subscribe to RSS Feed
- Permalink
- Report Inappropriate Content
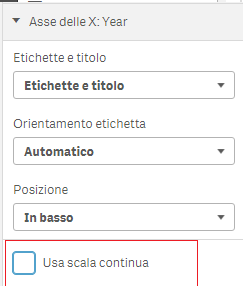
Uncheck

342 Views
Creator
2016-08-26
07:21 AM
Author
- Mark as New
- Bookmark
- Subscribe
- Mute
- Subscribe to RSS Feed
- Permalink
- Report Inappropriate Content
Can you please send in English Language.
341 Views
Master III
2016-08-26
07:27 AM
- Mark as New
- Bookmark
- Subscribe
- Mute
- Subscribe to RSS Feed
- Permalink
- Report Inappropriate Content
I'm sorry, I don't have english version.
341 Views
Community Browser