Unlock a world of possibilities! Login now and discover the exclusive benefits awaiting you.
- Qlik Community
- :
- Forums
- :
- Analytics
- :
- New to Qlik Analytics
- :
- Re: Help with AGGR function (I think!)
- Subscribe to RSS Feed
- Mark Topic as New
- Mark Topic as Read
- Float this Topic for Current User
- Bookmark
- Subscribe
- Mute
- Printer Friendly Page
- Mark as New
- Bookmark
- Subscribe
- Mute
- Subscribe to RSS Feed
- Permalink
- Report Inappropriate Content
Help with AGGR function (I think!)
Hi
I have a data set that contains duplicates, which I want to dedupe in the chart I created (Qlik Sense). Here's an example of what I have:
Region, Name, Course, Status
EMEA, John, A, Passed
EMEA, Natalie, A, Failed
APAC, Sue, B, Passed
AMER, Frank, C, Passed
EMEA, Jenny, A, Passed
APAC, Dipal, B, Failed
EMEA, John, A, Passed
APAC, Jo, A, Passed
AMER, Frank, C, Passed
And so on... I want to show the number of courses passed by Region and need to exclude the duplicates. So the result I'm looking for is as follows:
EMEA - 2
APAC - 2
AMER - 1
What I have so far is "count (if ([status] = 'passed', [course]))
This correctly counts the number of passed courses (without de-duping) so my results are:
EMEA - 3
APAC - 2
AMER - 2
Please can someone offer me some advice on how I can remove the duplicates? I think I may need to use the AGGR function?
Thanks,
Becs
- Tags:
- qlik sense measure
- Mark as New
- Bookmark
- Subscribe
- Mute
- Subscribe to RSS Feed
- Permalink
- Report Inappropriate Content
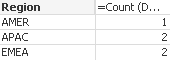
what about
"count (DISTINCT if ([status] = 'passed', [course]))
- Mark as New
- Bookmark
- Subscribe
- Mute
- Subscribe to RSS Feed
- Permalink
- Report Inappropriate Content
Thanks Tim. I can't count distinct course or name because I need to show where multiple people have passed a course or where a person has passed multiple coursed.
Does that make sense?
- Mark as New
- Bookmark
- Subscribe
- Mute
- Subscribe to RSS Feed
- Permalink
- Report Inappropriate Content
Hi Rebecca,
maybe
Count (DISTINCT if ([Status] = 'Passed', [Course]&Name))
Regards,
Antonio
- Mark as New
- Bookmark
- Subscribe
- Mute
- Subscribe to RSS Feed
- Permalink
- Report Inappropriate Content
- Mark as New
- Bookmark
- Subscribe
- Mute
- Subscribe to RSS Feed
- Permalink
- Report Inappropriate Content
Thanks Antonio, that appears to be correct!
I really appreciate your help on this!
- Mark as New
- Bookmark
- Subscribe
- Mute
- Subscribe to RSS Feed
- Permalink
- Report Inappropriate Content
I suggest using set analysis instead of using the if statement
Count(DISTINCT {<Status = {'Passed'}>} Name&'|'&Course)
- Mark as New
- Bookmark
- Subscribe
- Mute
- Subscribe to RSS Feed
- Permalink
- Report Inappropriate Content
Please close this thread by flag correct answer and may be helpful if reach your requirement
- Mark as New
- Bookmark
- Subscribe
- Mute
- Subscribe to RSS Feed
- Permalink
- Report Inappropriate Content
Please try
Count(distinct {<Status={'Passed'}>}Name)
hth
Sasi