Unlock a world of possibilities! Login now and discover the exclusive benefits awaiting you.
- Qlik Community
- :
- Forums
- :
- Analytics
- :
- New to Qlik Analytics
- :
- Re: Hide a Column/Display Sum Column Conditionally
- Subscribe to RSS Feed
- Mark Topic as New
- Mark Topic as Read
- Float this Topic for Current User
- Bookmark
- Subscribe
- Mute
- Printer Friendly Page
- Mark as New
- Bookmark
- Subscribe
- Mute
- Subscribe to RSS Feed
- Permalink
- Report Inappropriate Content
Hide a Column/Display Sum Column Conditionally
Hi
I have this situation, where based on the consultant, selected, i needed to show/hide column of total amount billed so far.
e.g
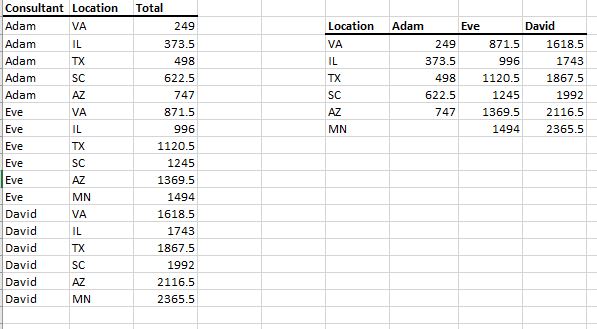
For the below data, I am trying to create a table on right side, and based on selection, if the particular consultant was not billed in that state, i would like the column for that consultant to hide.
So for Location = VA, David didnt get billed, so only total for Adam & Eve should be displayed. otherwise all three, if there's no filter on location.
- « Previous Replies
-
- 1
- 2
- Next Replies »
- Mark as New
- Bookmark
- Subscribe
- Mute
- Subscribe to RSS Feed
- Permalink
- Report Inappropriate Content
let's try with the below expression:
Sum( {< [Name] += {'Adam'} >} [Total] )
I hope it helps.
- Mark as New
- Bookmark
- Subscribe
- Mute
- Subscribe to RSS Feed
- Permalink
- Report Inappropriate Content
Hi agigliotti zhandos_shotan vegar.lie.arntsen stalwar1 .thank you so much that pretty solved the problem except for a fact that i have another subsequent problem now .. .
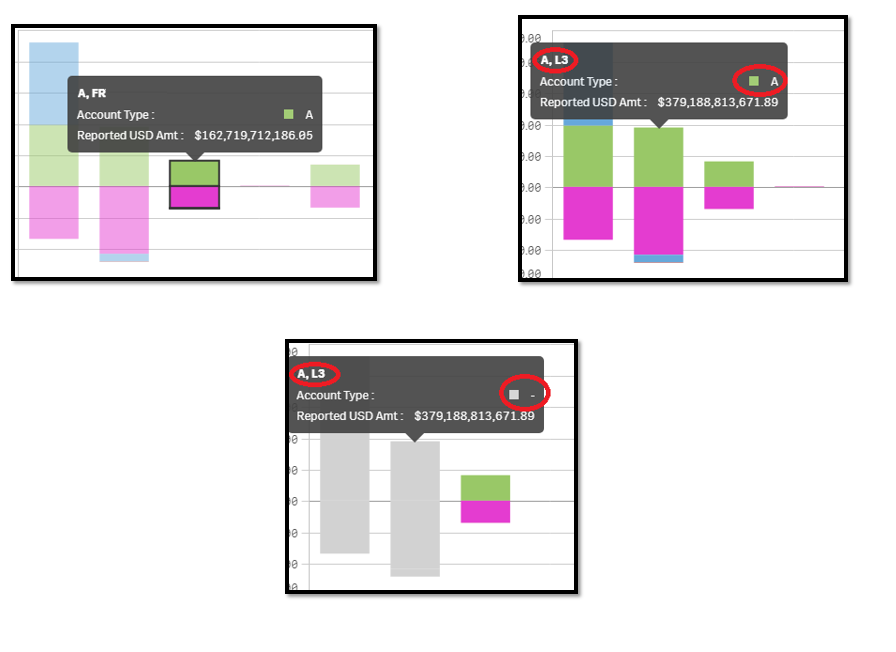
Situation: I have to keep the first two plots, regardless of the selection users make, from the rest of the bars. eg when user select the third graph for drilldown/selection, graph should display 1+2 & the 3rd one or any other that he has selected, keeping 1 & 2 on always.
With your earlier help with expression, I could manage to keep the 1& 2 bars there always, but when the selection is made, the first two graphs are getting grayed out for some reason.
I can see that somehow the dimension determining color, is not getting assigned properly as highlighted in screen 2 & 3, whereas i can see it getting populated in header of tool tip.
The expression, i am using on reported total is:
if(getselectedcount([Name])=0,Sum([Amount]),Sum({$<[Name]+={L2,L3}>}[Amount]))
where L2 & L3 are name for the first two bars.
Appreciate your help
- « Previous Replies
-
- 1
- 2
- Next Replies »