Unlock a world of possibilities! Login now and discover the exclusive benefits awaiting you.
- Qlik Community
- :
- Forums
- :
- Analytics
- :
- New to Qlik Analytics
- :
- Re: How to Change Bubble Chart Color?
- Subscribe to RSS Feed
- Mark Topic as New
- Mark Topic as Read
- Float this Topic for Current User
- Bookmark
- Subscribe
- Mute
- Printer Friendly Page
- Mark as New
- Bookmark
- Subscribe
- Mute
- Subscribe to RSS Feed
- Permalink
- Report Inappropriate Content
How to Change Bubble Chart Color?
Hi, I have a bubble chart, and am trying to change color of the bubble by a formula. I opened the Background Color of the Expression, entered the definition of : =if(Savings>2000, Green(), Red()) . If this was working, I would see a lot of green, the rest blue. Instead the bubbles stay red.. What am I missing? Thank you in advance.
- « Previous Replies
-
- 1
- 2
- Next Replies »
Accepted Solutions
- Mark as New
- Bookmark
- Subscribe
- Mute
- Subscribe to RSS Feed
- Permalink
- Report Inappropriate Content
try the background color on the first one
- Mark as New
- Bookmark
- Subscribe
- Mute
- Subscribe to RSS Feed
- Permalink
- Report Inappropriate Content
maybe you need a
sum(Savings)? or some other aggregation function
- Mark as New
- Bookmark
- Subscribe
- Mute
- Subscribe to RSS Feed
- Permalink
- Report Inappropriate Content
I tried that, didn't work. I even used a static color expression of Green(), still stays red. I'm guessing there is a
checkbox somewhere that needs to be unchecked? I looked and didn't see anything. Thank you.
- Mark as New
- Bookmark
- Subscribe
- Mute
- Subscribe to RSS Feed
- Permalink
- Report Inappropriate Content
is it the first expression?
value of saving?
- Mark as New
- Bookmark
- Subscribe
- Mute
- Subscribe to RSS Feed
- Permalink
- Report Inappropriate Content
Recently I wanted to have the bubble color change with the bubble size. Here's what I did...
Given:
Scatter plot Dimension: [Employee Name].
Scatter plot Measures: [Sales], [Years Employed], and [Quota] (all of these are being Summed).
In the color by expression field, my formula is:
Colormix1((Sum([Quota])-$(=min(aggr(Sum([Quota]),[Employee Name]))))/$(=(max(aggr(Sum([Quota]),[Employee Name]))-min(aggr(Sum([Quota]),[Employee Name]))))
,rgb(254,227,145)
,rgb(102,37,6))
The gist of the Colormix1() function is that you need to give it a value, then a start color, and an end color. Note: there is also a Colormix2() function which gives you the ability to set a midpoint color.
Hope this helps. See the first sheet of the attached qvf file.
- Mark as New
- Bookmark
- Subscribe
- Mute
- Subscribe to RSS Feed
- Permalink
- Report Inappropriate Content
Thanks Ian. I'll have to look into the Colormix function, seems very advanced  I'm not sure how to open your file?
- Mark as New
- Bookmark
- Subscribe
- Mute
- Subscribe to RSS Feed
- Permalink
- Report Inappropriate Content
No, it's the 3rd. See screen: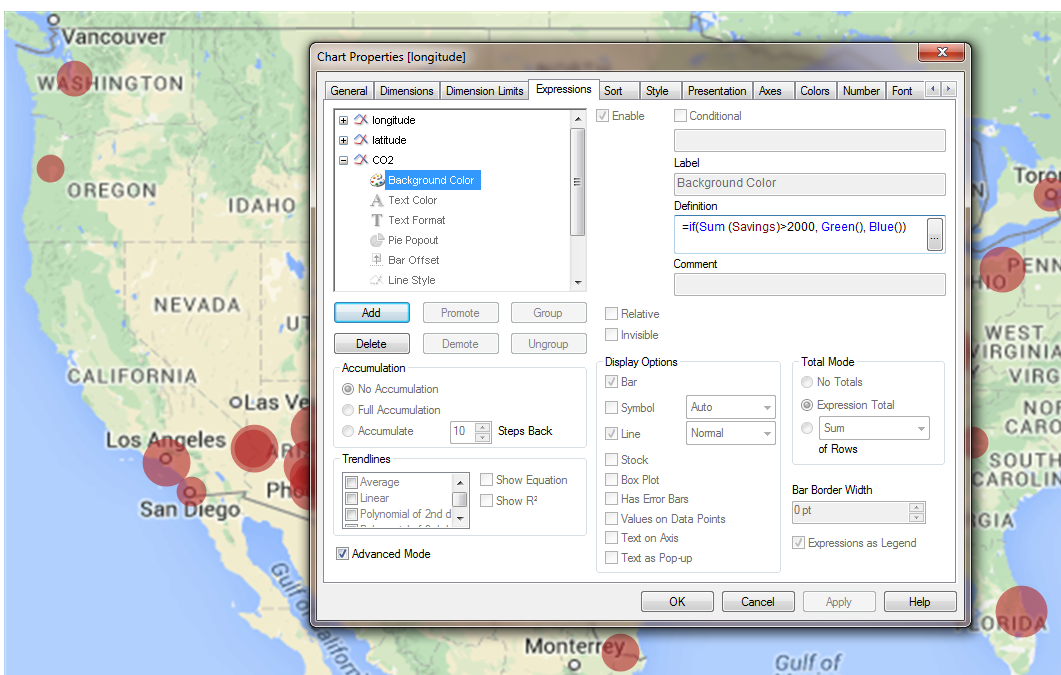
- Mark as New
- Bookmark
- Subscribe
- Mute
- Subscribe to RSS Feed
- Permalink
- Report Inappropriate Content
try the background color on the first one
- Mark as New
- Bookmark
- Subscribe
- Mute
- Subscribe to RSS Feed
- Permalink
- Report Inappropriate Content
You posted the question under Qlik Sense, but apparently you use QlikView, hence the confusion.
Can you try color on the dimension side rather than expression?
- Mark as New
- Bookmark
- Subscribe
- Mute
- Subscribe to RSS Feed
- Permalink
- Report Inappropriate Content
No, not the dimension. It is first expression, background color, as massimo.grassi said.
- « Previous Replies
-
- 1
- 2
- Next Replies »