Unlock a world of possibilities! Login now and discover the exclusive benefits awaiting you.
- Qlik Community
- :
- All Forums
- :
- Visualization and Usability
- :
- Re: How to add lineal trend in Qlik sense
- Subscribe to RSS Feed
- Mark Topic as New
- Mark Topic as Read
- Float this Topic for Current User
- Bookmark
- Subscribe
- Mute
- Printer Friendly Page
- Mark as New
- Bookmark
- Subscribe
- Mute
- Subscribe to RSS Feed
- Permalink
- Report Inappropriate Content
How to add lineal trend in Qlik sense
I would like to know how to add a lineal trend in a graph in Qlik Sense. Or an average trend also.
Thank you.
- « Previous Replies
- Next Replies »
Accepted Solutions
- Mark as New
- Bookmark
- Subscribe
- Mute
- Subscribe to RSS Feed
- Permalink
- Report Inappropriate Content
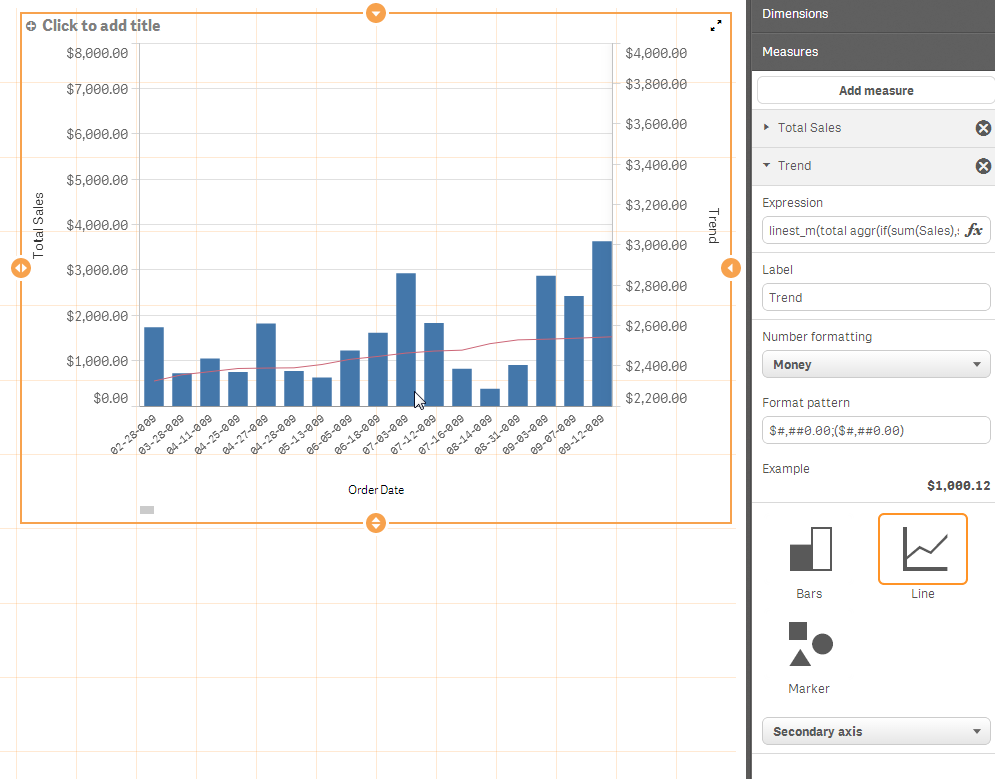
See attached .QVF - copy to: C:\Users\<user profile>\Documents\Qlik\Sense\Apps, restart Sense or press F5 - in the hub after copying if Sense is open. Launch the Trend app.
Please let me know if this is what you are after.
The expression below needs to be used and calculated as a new measure in combination with a combo chart:
linest_m(total aggr(if(sum(Sales),sum(Sales)),OrderDate),OrderDate)*
only({1}OrderDate)+linest_b(total aggr(if(sum(Sales),sum(Sales)),OrderDate),OrderDate)

Mike Tarallo
Qlik
- Mark as New
- Bookmark
- Subscribe
- Mute
- Subscribe to RSS Feed
- Permalink
- Report Inappropriate Content
Hi Mudito -
Let me see what we can do. I believe in this version, that capability does NOT exist yet out of the box and may need to be calculated as an additional measure.
The suggestion I provided earlier (reference lines) - is only for Horizontal and Vertical lines - associated with values you define or calculate - which is different than a lineal trend line.
Mike
Mike Tarallo
Qlik
- Mark as New
- Bookmark
- Subscribe
- Mute
- Subscribe to RSS Feed
- Permalink
- Report Inappropriate Content
Thank you. My doubt is about the expression I should use if I have a monthly series of volumes for instance.
- Mark as New
- Bookmark
- Subscribe
- Mute
- Subscribe to RSS Feed
- Permalink
- Report Inappropriate Content
See attached .QVF - copy to: C:\Users\<user profile>\Documents\Qlik\Sense\Apps, restart Sense or press F5 - in the hub after copying if Sense is open. Launch the Trend app.
Please let me know if this is what you are after.
The expression below needs to be used and calculated as a new measure in combination with a combo chart:
linest_m(total aggr(if(sum(Sales),sum(Sales)),OrderDate),OrderDate)*
only({1}OrderDate)+linest_b(total aggr(if(sum(Sales),sum(Sales)),OrderDate),OrderDate)

Mike Tarallo
Qlik
- Mark as New
- Bookmark
- Subscribe
- Mute
- Subscribe to RSS Feed
- Permalink
- Report Inappropriate Content
I updated my post and the attachment - here is the correct one.
Mike Tarallo
Qlik
- Mark as New
- Bookmark
- Subscribe
- Mute
- Subscribe to RSS Feed
- Permalink
- Report Inappropriate Content
Thank you so much!
For further versions, it would be useful if they put the trend line as an option to include in graphs.
Also in combined graphs it would be useful to be able to show measures in graph (right now it does not seem possible).
Thank you.
- Mark as New
- Bookmark
- Subscribe
- Mute
- Subscribe to RSS Feed
- Permalink
- Report Inappropriate Content
Awesome - glad I could help. There are a lot of improvements that will be added to all the charts in Sense, gradually added overtime, this is just the beginning for Sense but not for Qlik.
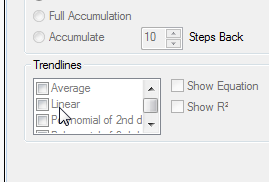
Note that in the QlikView product - this capability (trend lines) is built in to the chart object properties panel. Keeping in mind that Sense and QlikView are two different products, that address similar and different types of business needs.
Here is the screenshot of the QlikView chart interface as a reference:

Stay in touch
Mike
Mike Tarallo
Qlik
- Mark as New
- Bookmark
- Subscribe
- Mute
- Subscribe to RSS Feed
- Permalink
- Report Inappropriate Content
Great! Thanks a lot!
- Mark as New
- Bookmark
- Subscribe
- Mute
- Subscribe to RSS Feed
- Permalink
- Report Inappropriate Content
I understand the use of the linest_* functions, but why is ONLY() necessary? Also, is there a way to align the Y axes of Trend and Total Sales? To the unaware, the separate alignments may cause confusion.
Thanks for a great answer to the OP.'s question.
- Mark as New
- Bookmark
- Subscribe
- Mute
- Subscribe to RSS Feed
- Permalink
- Report Inappropriate Content
Mike
Its been 2 years since this thread was posted - As you said Sense has come a long way in those 2 years - but as of 3.0 I still don't see this feature. I hear 3.0 r1 just was released and will look in notes to see if its there but if not (and I suspect not) is this on the radar for 2016?
Thanks
- « Previous Replies
- Next Replies »