Unlock a world of possibilities! Login now and discover the exclusive benefits awaiting you.
Announcements
NEW: Seamless Public Data Sharing with Qlik's New Anonymous Access Capability:
TELL ME MORE!
- Qlik Community
- :
- Forums
- :
- Analytics
- :
- New to Qlik Analytics
- :
- How to change the color of the values in Stacked G...
Options
- Subscribe to RSS Feed
- Mark Topic as New
- Mark Topic as Read
- Float this Topic for Current User
- Bookmark
- Subscribe
- Mute
- Printer Friendly Page
Turn on suggestions
Auto-suggest helps you quickly narrow down your search results by suggesting possible matches as you type.
Showing results for
Not applicable
2017-05-10
03:31 AM
- Mark as New
- Bookmark
- Subscribe
- Mute
- Subscribe to RSS Feed
- Permalink
- Report Inappropriate Content
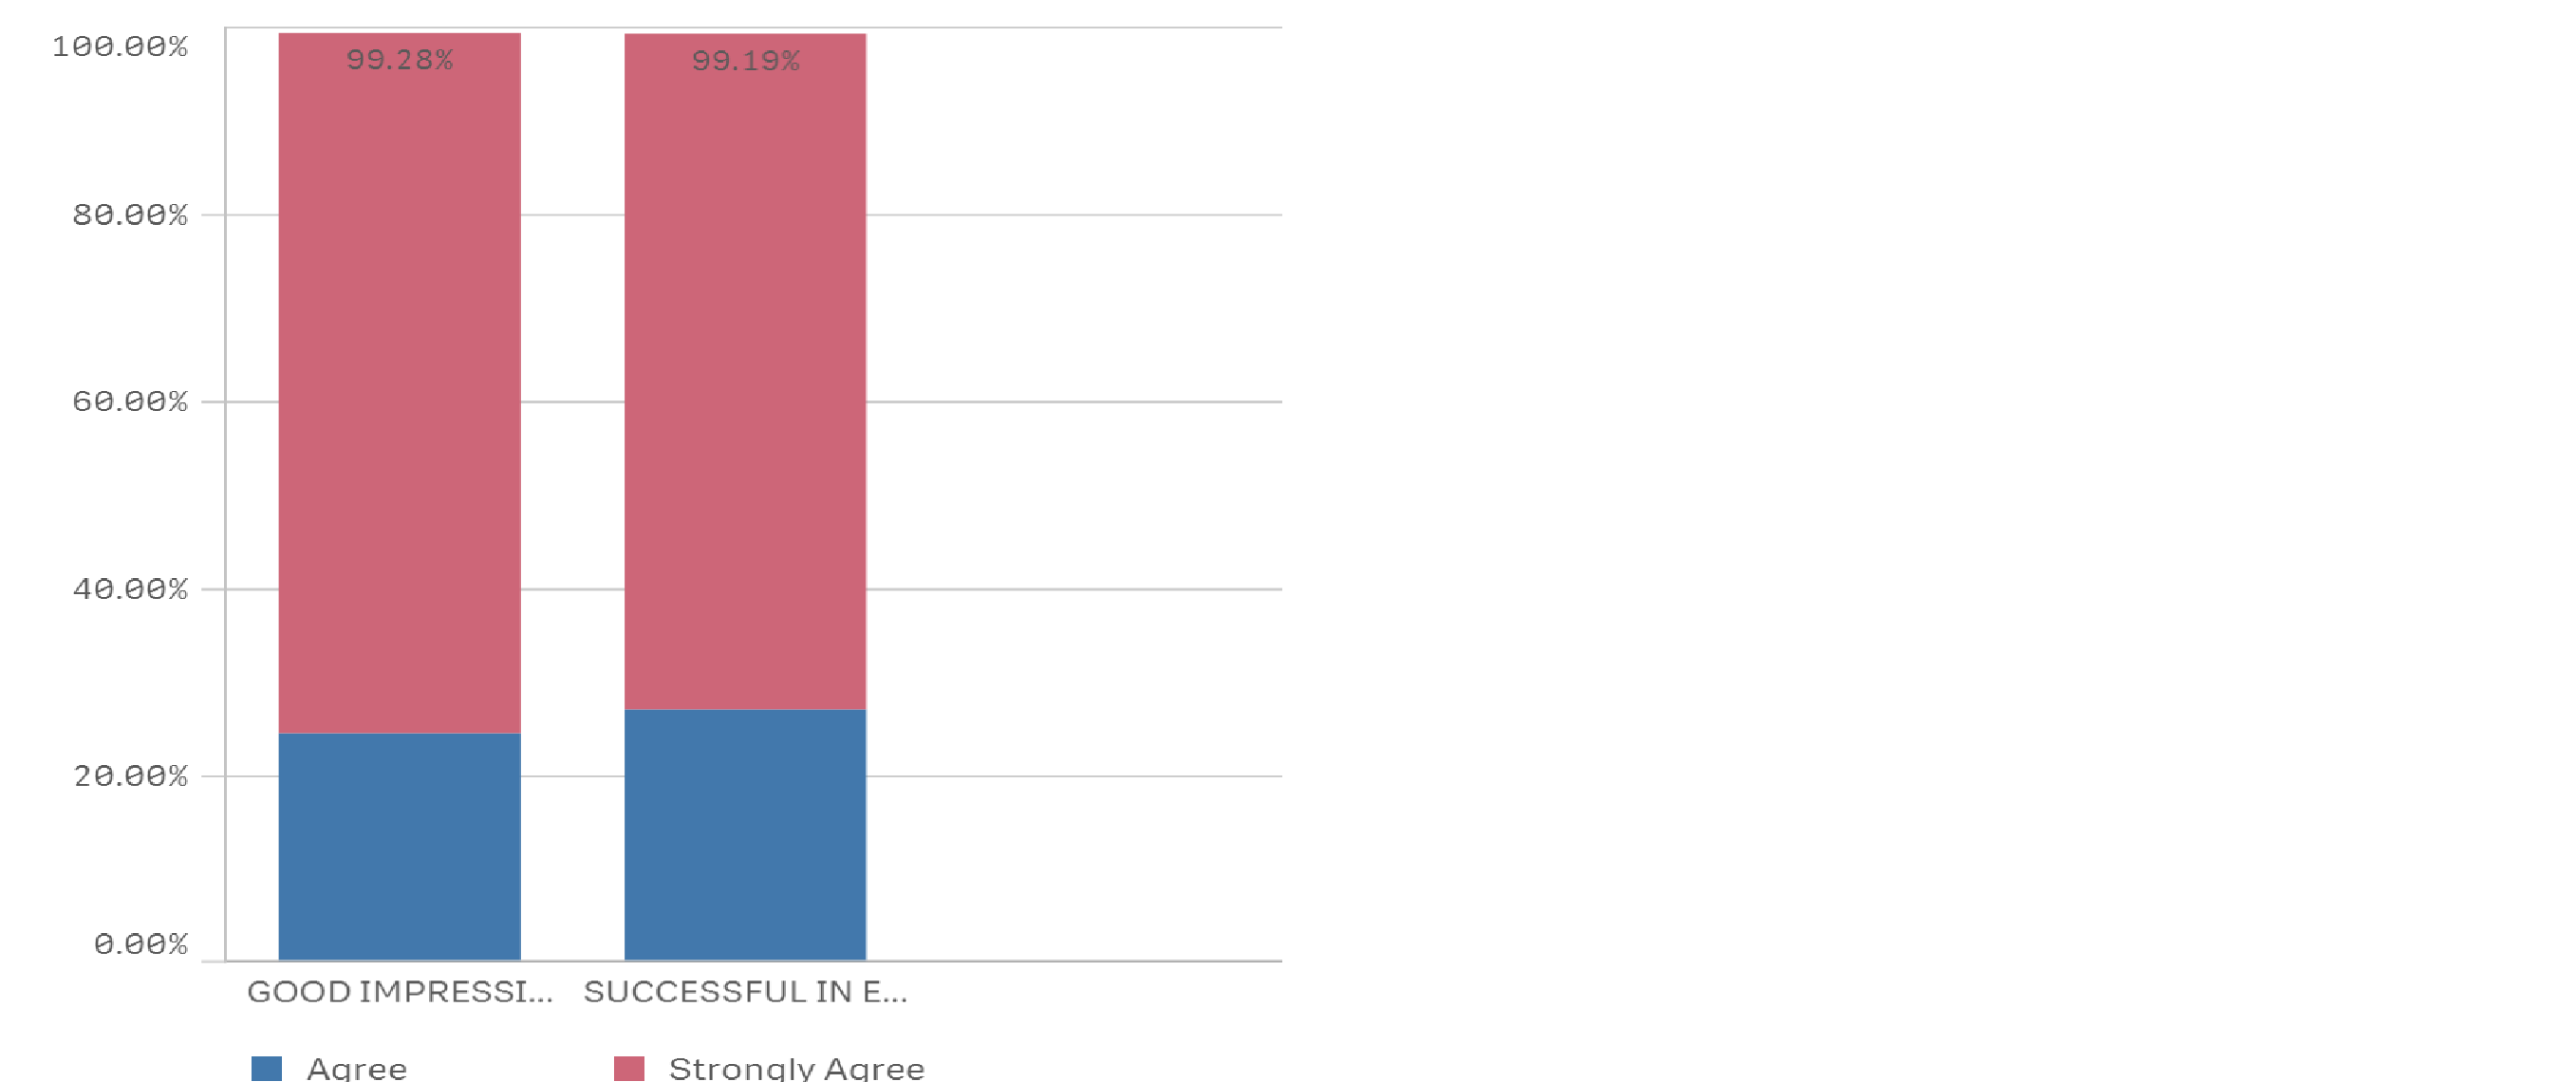
How to change the color of the values in Stacked Graph?
Hello All,
I need to change the color from black to white in the values which i got by stacked graph

Values in the graph:99.28% and 99.19% [ i need to change the color from black to white]
Dimension 1: if(match(question_id,'Q1','Q2'),if(question_id='Q1','GOOD IMPRESSION',if(question_id='Q2','SUCCESSFUL IN EDUCATING')))
Dimension 2: if((Match(answer_text,'Strongly Agree','Excellent')),'Strongly Agree',if(Match(answer_text,'Agree','Above Average'),'Agree'))
Measure: count(distinct{<question_id={'Q1','Q2'}>} lender_offer_id)/count(distinct {<question_id={'Q1','Q2'}>} total lender_offer_id)
473 Views
0 Replies
Community Browser