Unlock a world of possibilities! Login now and discover the exclusive benefits awaiting you.
- Qlik Community
- :
- All Forums
- :
- Visualization and Usability
- :
- Re: Re: How to create a map chart?
- Subscribe to RSS Feed
- Mark Topic as New
- Mark Topic as Read
- Float this Topic for Current User
- Bookmark
- Subscribe
- Mute
- Printer Friendly Page
- Mark as New
- Bookmark
- Subscribe
- Mute
- Subscribe to RSS Feed
- Permalink
- Report Inappropriate Content
How to create a map chart?
Does anybody has figured out how to create a map chart?
thanks
- Tags:
- map(beta)
Accepted Solutions
- Mark as New
- Bookmark
- Subscribe
- Mute
- Subscribe to RSS Feed
- Permalink
- Report Inappropriate Content
Hey Guys - here is the video and samples:
KML US and World Map and Sample Data
Mike Tarallo
Qlik
- Mark as New
- Bookmark
- Subscribe
- Mute
- Subscribe to RSS Feed
- Permalink
- Report Inappropriate Content
Are you talking about an interactive Map chart?
- Mark as New
- Bookmark
- Subscribe
- Mute
- Subscribe to RSS Feed
- Permalink
- Report Inappropriate Content
Hi,
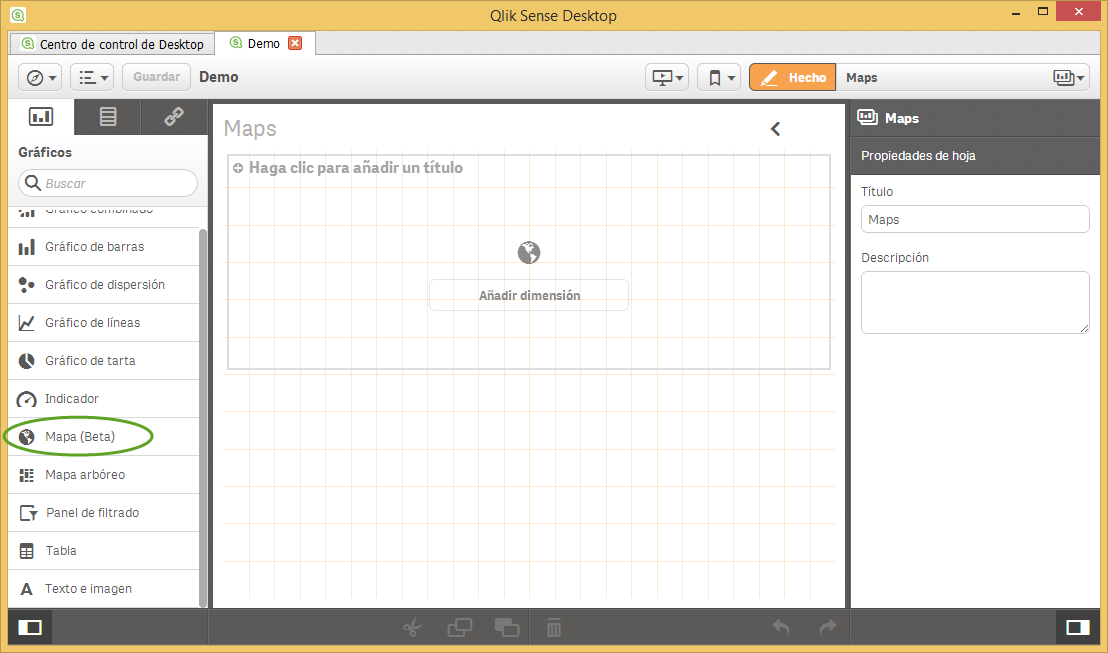
I'm refering to getting to work this chart option:

- Mark as New
- Bookmark
- Subscribe
- Mute
- Subscribe to RSS Feed
- Permalink
- Report Inappropriate Content
You will need to either load a KML file in the script editor, or tag map fields in the script with either $geopoint or $geopolygon.
Example:
TAG FIELD "Area" WITH $geopolygon;
I have attached two sample KML files that can be used in Qlik Sense. Please note, for tagging map points, fields must be formatted as [longitude, latitude] with the square brackets included.
- Mark as New
- Bookmark
- Subscribe
- Mute
- Subscribe to RSS Feed
- Permalink
- Report Inappropriate Content
Hello,
Just a quick point on this - note the (Beta) next to the mapping chart type. We are continuously working to improve this functionality and make it more intuitive and powerful going forward.
Thanks!
- Mark as New
- Bookmark
- Subscribe
- Mute
- Subscribe to RSS Feed
- Permalink
- Report Inappropriate Content
To follow up on Sean's answer, the Qlik Sense Desktop Help has a detailed explanation on how to create a map chart. http://help.qlik.com/sense/en-US/online/index.html#../Subsystems/Qlik_Sense_Desktop_help/Content/Vis...
Help users find answers! Don't forget to mark a solution that worked for you!
- Mark as New
- Bookmark
- Subscribe
- Mute
- Subscribe to RSS Feed
- Permalink
- Report Inappropriate Content
There is also a video in the works describing this process for the Map(Beta). It will be posted in the the documents section shortly.
Thanks
Mike Tarallo
Qlik
- Mark as New
- Bookmark
- Subscribe
- Mute
- Subscribe to RSS Feed
- Permalink
- Report Inappropriate Content
Hey Guys - here is the video and samples:
KML US and World Map and Sample Data
Mike Tarallo
Qlik
- Mark as New
- Bookmark
- Subscribe
- Mute
- Subscribe to RSS Feed
- Permalink
- Report Inappropriate Content
Hello @Michael_Tarallo ,
I have one question , is this option available also in qlikview, if yes would you please guide me How could I use it?
Thank you in advance.
Regards,
Matsa