Unlock a world of possibilities! Login now and discover the exclusive benefits awaiting you.
- Qlik Community
- :
- All Forums
- :
- Visualization and Usability
- :
- How to create multi-dimension Bar Charts
- Subscribe to RSS Feed
- Mark Topic as New
- Mark Topic as Read
- Float this Topic for Current User
- Bookmark
- Subscribe
- Mute
- Printer Friendly Page
- Mark as New
- Bookmark
- Subscribe
- Mute
- Subscribe to RSS Feed
- Permalink
- Report Inappropriate Content
How to create multi-dimension Bar Charts
Hi everyone,
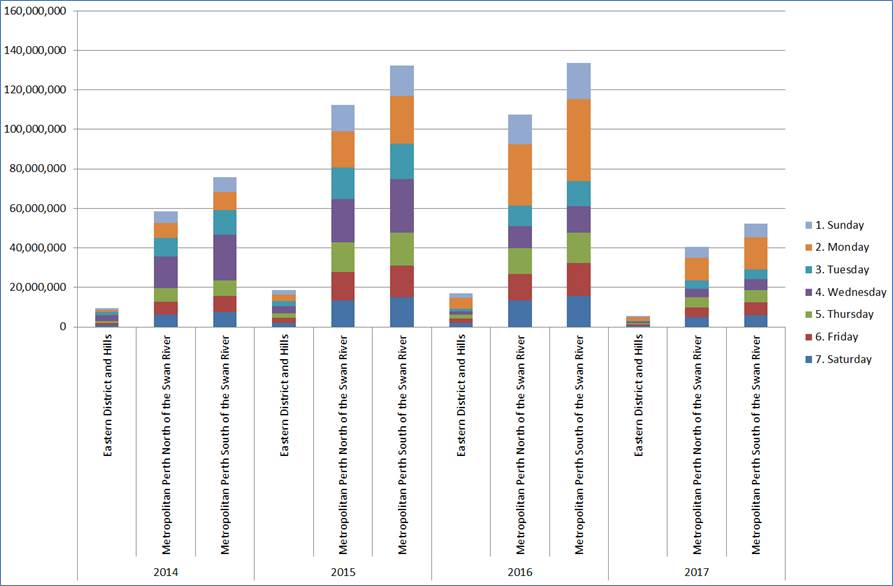
My name is John and I am trying to build a bar chart in Qlik sense having the the similar appearance and attributes as the image below:
But due to my lack of knowledge, I only managed to create the following bar chart in my first attempt:
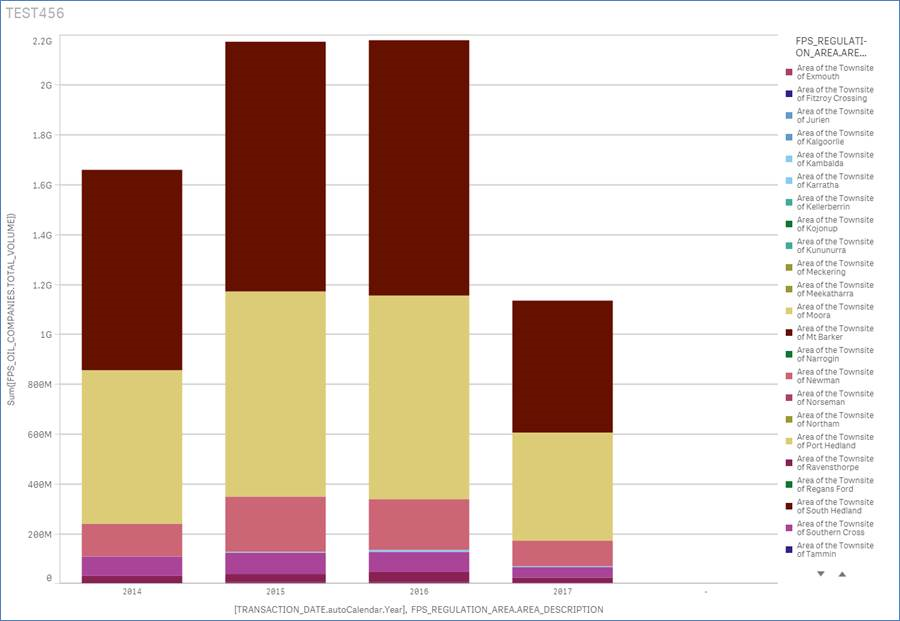
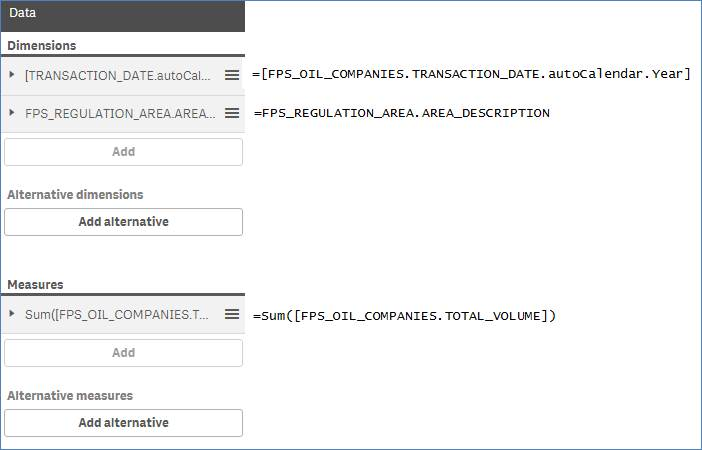
The problem I have is I do not know where and how to create the weekday(FPS_OIL_COMPANIES.TRANSACTION_DATE) to display as an extra dimension as the Add button under the Dimensions pane is dim and not enabled. I think I need to concatenate it with the existing dimension FPS_OIL_COMPANIES.TRANSACTION_DATE.autoCalendar.Year. Here are the Dimensions and Measures and their respective fields used to build the above chart:
Any assistance and suggestions are appreciated or perhaps I should have chosen other chart option type to build my chart and not relying on Bar Chart, please advise as well. Thank you for your assistance.
Regards,
John