Unlock a world of possibilities! Login now and discover the exclusive benefits awaiting you.
- Qlik Community
- :
- Forums
- :
- Analytics
- :
- New to Qlik Analytics
- :
- How to create stacked bar chart with line ?
- Subscribe to RSS Feed
- Mark Topic as New
- Mark Topic as Read
- Float this Topic for Current User
- Bookmark
- Subscribe
- Mute
- Printer Friendly Page
- Mark as New
- Bookmark
- Subscribe
- Mute
- Subscribe to RSS Feed
- Permalink
- Report Inappropriate Content
How to create stacked bar chart with line ?
Dear friends,
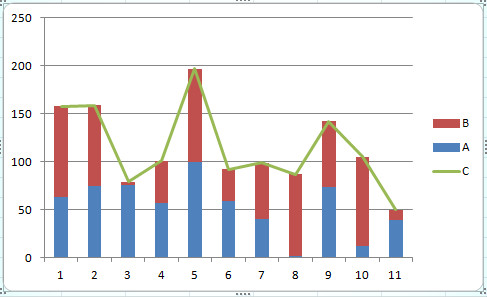
Do anyone know how to create a stacked bar chart, with line in Qlik Sense ? Please see attached image which is what I expect. Number of lIne C is sum of A and B.
Thank you.
- « Previous Replies
-
- 1
- 2
- Next Replies »
- Mark as New
- Bookmark
- Subscribe
- Mute
- Subscribe to RSS Feed
- Permalink
- Report Inappropriate Content
Hello,
Is there a way to choose witch bar are stacked together?
In my chart, I would like :
- 1 stack bar for Sales & Cumulative Sales
- 1 stack bar for Sales & Cumulative Sales Year -1
My lines are for objectives Y and Y-1
Thanks
Matthieu
- Mark as New
- Bookmark
- Subscribe
- Mute
- Subscribe to RSS Feed
- Permalink
- Report Inappropriate Content
I followed the steps and created the combo chart with 2 stacked bars and 1 line. the line is simply the sum of the stacked bars, but I would like it to be the trendline (of the sum) instead of just being the sum. Any suggestions on how to achieve that?
- « Previous Replies
-
- 1
- 2
- Next Replies »