Unlock a world of possibilities! Login now and discover the exclusive benefits awaiting you.
- Qlik Community
- :
- Forums
- :
- Analytics
- :
- New to Qlik Analytics
- :
- Re: How to define background color of auto-sum row...
- Subscribe to RSS Feed
- Mark Topic as New
- Mark Topic as Read
- Float this Topic for Current User
- Bookmark
- Subscribe
- Mute
- Printer Friendly Page
- Mark as New
- Bookmark
- Subscribe
- Mute
- Subscribe to RSS Feed
- Permalink
- Report Inappropriate Content
How to define background color of auto-sum row in Pivot Table?
Dear QS Experts
I am new to QS and I have a question about color by expression
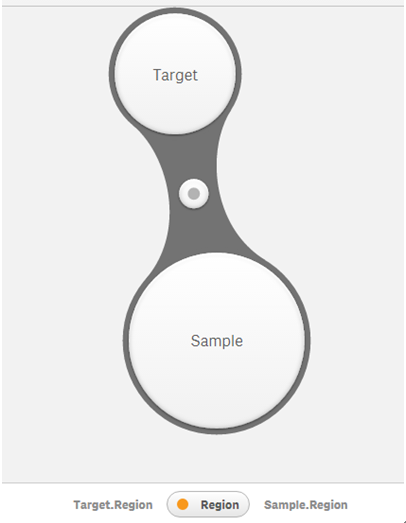
I have 2 sheets (‘Sample’ & ‘Target’) and linked via ‘Region’ column in QS as below
Then I create a simple pivot table with auto-sum row and set background color with expression. The measurement is Make% ---- Count({<[Met]={'1'}>}[Order Line])/Count([Order Line]
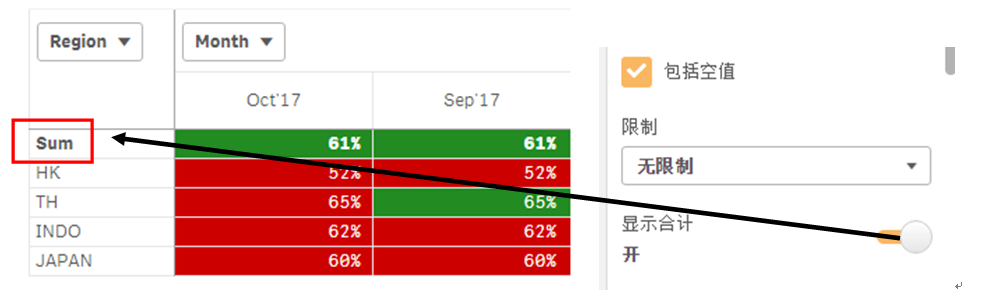
If Make% meet the target in ‘Target’ sheet then it shows green otherwise green. Color expression as below
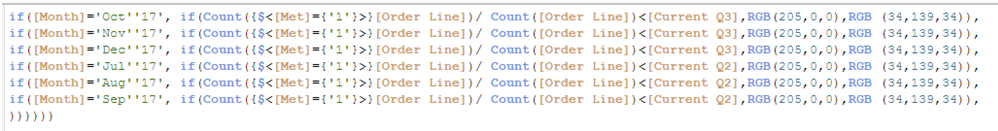
There is no sum target in the target sheet and I am not allowed to change raw data
But sum target calculation method is as below:
Q2: ((HK(0.63)+TH(0.65)+INDO(0.72)+JAPAN(0.63))/4=0.65
Q3: ((HK(0.65)+TH(0.67)+INDO(0.75)+JAPAN(0.65))/4=0.68
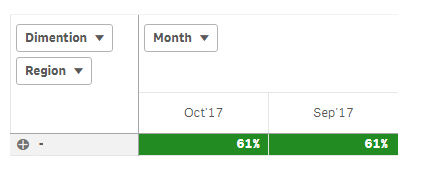
All the rows work well except the ‘Auto-Sum’ row. As you can see 61% is lower than above sum Q2 & Q3 target but it still shows green color
May I know how to adjust my expression to make it right?
You could check attached raw data and apps for your reference
Thanks for your advice in advance
Ivan
- « Previous Replies
-
- 1
- 2
- Next Replies »
Accepted Solutions
- Mark as New
- Bookmark
- Subscribe
- Mute
- Subscribe to RSS Feed
- Permalink
- Report Inappropriate Content
Hi
i have updated your app but hard coded the value 0.68 and 0.65 in the background color . change that value as per your requirement and it shall give you the result. if stuck somewhere tell me the exact expression for back ground color of sum row i will update it.
edit :inplace of 0.65 and 0.68 put the expression
regards
Pradosh
- Mark as New
- Bookmark
- Subscribe
- Mute
- Subscribe to RSS Feed
- Permalink
- Report Inappropriate Content
Pradosh
Thank you so much for the reply
It works well so far
May I know what does dimensionality()=0 mean?
Best Regards
Ivan
- Mark as New
- Bookmark
- Subscribe
- Mute
- Subscribe to RSS Feed
- Permalink
- Report Inappropriate Content
dimensionality is always 0 for summary rows. try putting an extra column with expression dimesnionality() and you will know what it returns.
regards
Pradosh
- Mark as New
- Bookmark
- Subscribe
- Mute
- Subscribe to RSS Feed
- Permalink
- Report Inappropriate Content
Pradosh
I am still little bit confused about 'dimensionality is always 0'. I try your way and result like below
Does it mean that result equals to auto sum function? If so, why the color turn back to green again?
Best Regards
Ivan
- Mark as New
- Bookmark
- Subscribe
- Mute
- Subscribe to RSS Feed
- Permalink
- Report Inappropriate Content
whats your expression for summary row target value ?
can you post that ?
let me have a look at it. if it is les then your calulated value it will turn green else red. thats what happened woth o.68 and 0.65 . change it and you will see the diffrence
regards
Pradosh
- Mark as New
- Bookmark
- Subscribe
- Mute
- Subscribe to RSS Feed
- Permalink
- Report Inappropriate Content
Pradosh
Please kindly check the attahced apps for your reference
Best Regards
Ivan
- Mark as New
- Bookmark
- Subscribe
- Mute
- Subscribe to RSS Feed
- Permalink
- Report Inappropriate Content
this is not the same app we were using ?
- Mark as New
- Bookmark
- Subscribe
- Mute
- Subscribe to RSS Feed
- Permalink
- Report Inappropriate Content
Pradosh
I just add dimesnionality() as you instructed. Color expression keeps unchanged
Best Regards
Ivan
- Mark as New
- Bookmark
- Subscribe
- Mute
- Subscribe to RSS Feed
- Permalink
- Report Inappropriate Content
I have added the dimensionality column for your reference.Hope it will be helpful.
regards
Pradosh
- « Previous Replies
-
- 1
- 2
- Next Replies »