Unlock a world of possibilities! Login now and discover the exclusive benefits awaiting you.
- Qlik Community
- :
- All Forums
- :
- Visualization and Usability
- :
- Re: How to drill down and see the records of visua...
- Subscribe to RSS Feed
- Mark Topic as New
- Mark Topic as Read
- Float this Topic for Current User
- Bookmark
- Subscribe
- Mute
- Printer Friendly Page
- Mark as New
- Bookmark
- Subscribe
- Mute
- Subscribe to RSS Feed
- Permalink
- Report Inappropriate Content
How to drill down and see the records of visualizations?
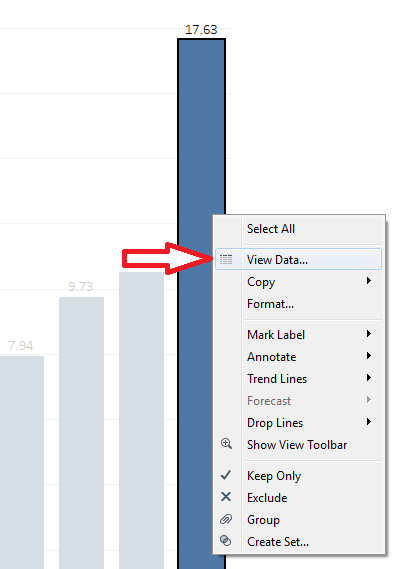
I am new to Qlik. Is there anyways that we could see the records or drill down to detail of a selection in Qlik similar to drill down in Tableau or view records in PowerBI? ( similar to the snapshot below)

- Tags:
- dril down
- qlik sensce
Accepted Solutions
- Mark as New
- Bookmark
- Subscribe
- Mute
- Subscribe to RSS Feed
- Permalink
- Report Inappropriate Content
EDITED
to apply your drill down on a chart:
1. on the right panel, use the drill down name on the dimension name (change your actual dimension) THIS IS NOT POSSIBLE
2. drag and drop the drill down dimension from the left panel to your actual chart.
to navigate through your dimensions using the drill down, just click on any value (a bar for example), the chart will move automatically to the second dimension defined on the drill-down dimension.
- Mark as New
- Bookmark
- Subscribe
- Mute
- Subscribe to RSS Feed
- Permalink
- Report Inappropriate Content
Hi,
I can recommend you this:
1. Create a drill down dimension
2. when you reach the desired dimension whith a drill down (on a bar chart for example), right button, export as data.
or
you can show values on top of the bars
- Mark as New
- Bookmark
- Subscribe
- Mute
- Subscribe to RSS Feed
- Permalink
- Report Inappropriate Content
Can you provide and example on how to create drill down dimension. Are you referring to add alternative dimension?
- Mark as New
- Bookmark
- Subscribe
- Mute
- Subscribe to RSS Feed
- Permalink
- Report Inappropriate Content
No, Drill down dimension and alternative dimension are different features.
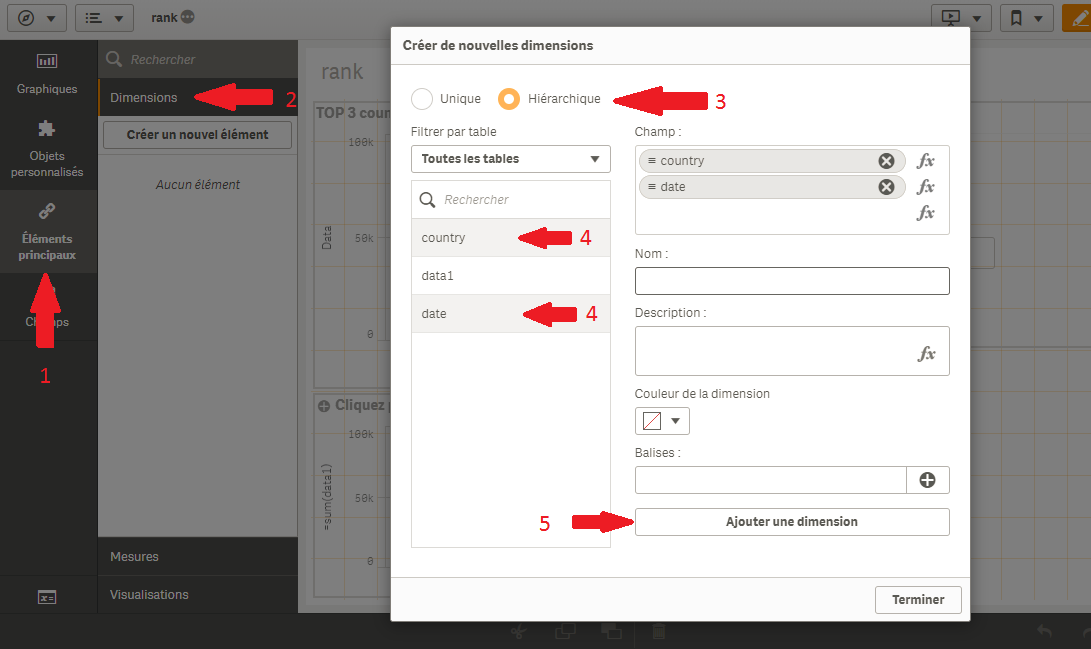
for drill down, you can do like described on the pic (I don't think it is necessary to translate):

Step 4: choose the dimensions (sorted the way you want) that you want to use on your drill down.
when you validate Step 5, you will see a logo appearing below the master dimensions, just use this master dimension (drop it directly on the chart you already use and choose replace) to be able to drill down between the dimensions you choose when configuring your drill down.
- Mark as New
- Bookmark
- Subscribe
- Mute
- Subscribe to RSS Feed
- Permalink
- Report Inappropriate Content
I got that but how do you apply that drill down? for instance if I want to see the drill down of the slice of the chart above, how would you apply this new dimension to see the underlying records?
- Mark as New
- Bookmark
- Subscribe
- Mute
- Subscribe to RSS Feed
- Permalink
- Report Inappropriate Content
EDITED
to apply your drill down on a chart:
1. on the right panel, use the drill down name on the dimension name (change your actual dimension) THIS IS NOT POSSIBLE
2. drag and drop the drill down dimension from the left panel to your actual chart.
to navigate through your dimensions using the drill down, just click on any value (a bar for example), the chart will move automatically to the second dimension defined on the drill-down dimension.
- Mark as New
- Bookmark
- Subscribe
- Mute
- Subscribe to RSS Feed
- Permalink
- Report Inappropriate Content
Thank you!
- Mark as New
- Bookmark
- Subscribe
- Mute
- Subscribe to RSS Feed
- Permalink
- Report Inappropriate Content
you're welcome.
Good luck