Unlock a world of possibilities! Login now and discover the exclusive benefits awaiting you.
- Qlik Community
- :
- Forums
- :
- Analytics
- :
- New to Qlik Analytics
- :
- Re: How to show value and % in a stacked bar in ql...
- Subscribe to RSS Feed
- Mark Topic as New
- Mark Topic as Read
- Float this Topic for Current User
- Bookmark
- Subscribe
- Mute
- Printer Friendly Page
- Mark as New
- Bookmark
- Subscribe
- Mute
- Subscribe to RSS Feed
- Permalink
- Report Inappropriate Content
How to show value and % in a stacked bar in qlik sense
Hi Guys,
I have created a stacked bar in qlik sense and want to see the values as well as % share for the different segments in the stack. How do I achieve this? Please advise.
Regards,
Rony
- Mark as New
- Bookmark
- Subscribe
- Mute
- Subscribe to RSS Feed
- Permalink
- Report Inappropriate Content
you could use https://www.vizlib.com/barchart/
it's a certified extension free up to 5 users.
If i well remember it has a custom tooltip where you can display also your second measure.
I hope it can helps.
- Mark as New
- Bookmark
- Subscribe
- Mute
- Subscribe to RSS Feed
- Permalink
- Report Inappropriate Content
You don't need to put Product in the expression. If your dimensions are Year and Product and measure is Sum([Sales Volume]), then Sum([Sales Volume])/Sum(TOTAL <Year> [Sales Volume]) will give you a share of sales of products within that year (i.e. Sales for 2018 = 100%, Sales of Product1 in 2018 = 20%, Sales of Product2 in 2018 = 80%).
- Mark as New
- Bookmark
- Subscribe
- Mute
- Subscribe to RSS Feed
- Permalink
- Report Inappropriate Content
Hi Juraj,
This worked. Thanks.
Regards,
Rony
- Mark as New
- Bookmark
- Subscribe
- Mute
- Subscribe to RSS Feed
- Permalink
- Report Inappropriate Content
Hi Andrea,
I will try this and get back to you. Thank you for your help.
Regards,
Rony
- Mark as New
- Bookmark
- Subscribe
- Mute
- Subscribe to RSS Feed
- Permalink
- Report Inappropriate Content
Hi Zhandos,
I believe this expression would go in "Custom Number Formatting" in measures. I am entering the expression as is but it does not seem to be working. My dimension is product and measure is volume. Could you please give me the exact expression? Thanks for your help.
Regards,
Rony
- Mark as New
- Bookmark
- Subscribe
- Mute
- Subscribe to RSS Feed
- Permalink
- Report Inappropriate Content
if(DS/TS='PercentValue', Num(Volume, '0.0 %'), Volume)
- Mark as New
- Bookmark
- Subscribe
- Mute
- Subscribe to RSS Feed
- Permalink
- Report Inappropriate Content
Zhandos,
I am not able to get this. Please help.
Regards,
Rony
- Mark as New
- Bookmark
- Subscribe
- Mute
- Subscribe to RSS Feed
- Permalink
- Report Inappropriate Content
Ok!
I reveiwed your comments and i think understand what you want.
You Can hint both value and % share on stacked bars on every segment!
But it will be shown only if you move mouse to segment as a hint. Because standart barchart show directly only total values of bar.
The decision is color expression for segments. It will be shown as second value.
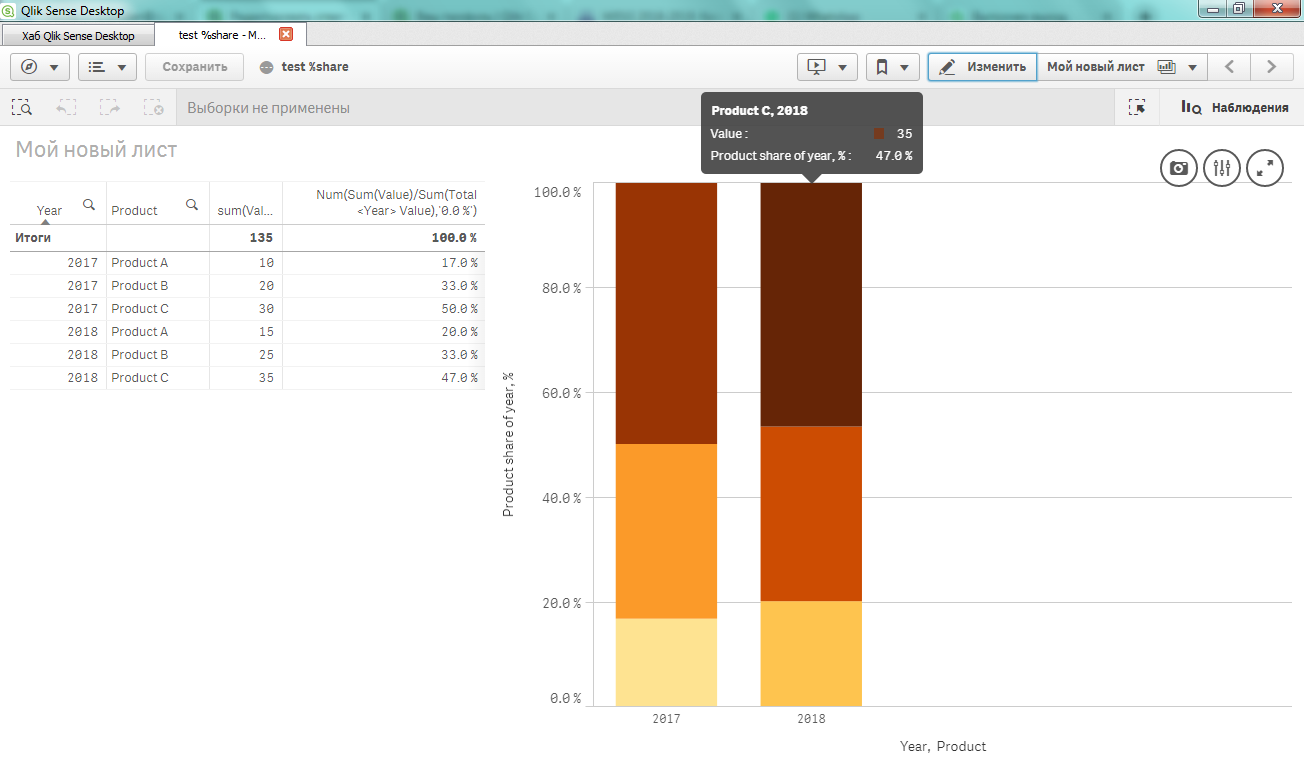
So here is my file.
Hope it is your solution.
P/S: Sorry, my english is not good.
- Mark as New
- Bookmark
- Subscribe
- Mute
- Subscribe to RSS Feed
- Permalink
- Report Inappropriate Content
Hi Juraj,
I just applied this formula (Sum([Sales Volume])/Sum(TOTAL <Year> [Sales Volume]) to a line chart but there is some issue here. I have data from 2014-2018. What is happening here is the share of sales for Product A for the year 2014 is being calculated over the total sales from 2014-2018, for all products i.e, (Product A volume 2014/ All products volume from 2014-2018). I hope my explanation is clear. Could you please help and let me know where I am going wrong?
Regards,
Rony
- Mark as New
- Bookmark
- Subscribe
- Mute
- Subscribe to RSS Feed
- Permalink
- Report Inappropriate Content
Hi Rony,
Is [Year] your dimension? If not, you need to adjust the expression accordingly.
Juraj