Unlock a world of possibilities! Login now and discover the exclusive benefits awaiting you.
- Qlik Community
- :
- Forums
- :
- Analytics
- :
- New to Qlik Analytics
- :
- Re: How to show value and % in a stacked bar in ql...
- Subscribe to RSS Feed
- Mark Topic as New
- Mark Topic as Read
- Float this Topic for Current User
- Bookmark
- Subscribe
- Mute
- Printer Friendly Page
- Mark as New
- Bookmark
- Subscribe
- Mute
- Subscribe to RSS Feed
- Permalink
- Report Inappropriate Content
How to show value and % in a stacked bar in qlik sense
Hi Guys,
I have created a stacked bar in qlik sense and want to see the values as well as % share for the different segments in the stack. How do I achieve this? Please advise.
Regards,
Rony
- Mark as New
- Bookmark
- Subscribe
- Mute
- Subscribe to RSS Feed
- Permalink
- Report Inappropriate Content
Hi Juraj,
Yes. Year and product are the dimensions. How do I proceed?]
Rony
- Mark as New
- Bookmark
- Subscribe
- Mute
- Subscribe to RSS Feed
- Permalink
- Report Inappropriate Content
This is strange. Can you post a screenshot, ideally with contents of the Properties pane?
- Mark as New
- Bookmark
- Subscribe
- Mute
- Subscribe to RSS Feed
- Permalink
- Report Inappropriate Content
Juraj,
What do you mean by contents of the properties pane?
- Mark as New
- Bookmark
- Subscribe
- Mute
- Subscribe to RSS Feed
- Permalink
- Report Inappropriate Content
Something like this:
- Mark as New
- Bookmark
- Subscribe
- Mute
- Subscribe to RSS Feed
- Permalink
- Report Inappropriate Content
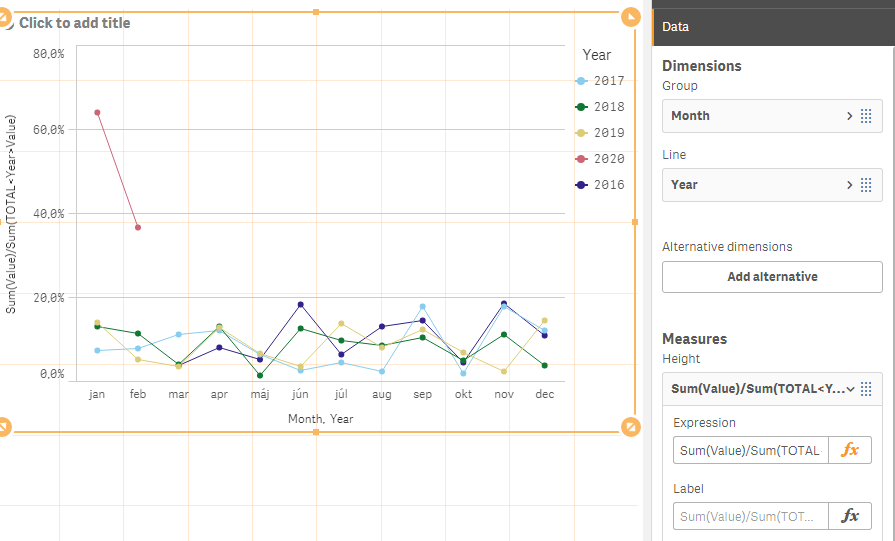
Hi Juraj,
Please see below. The % share of the products are not totaling up to 100%. I am looking for a cumulative value of the products to be shown for each year respectively.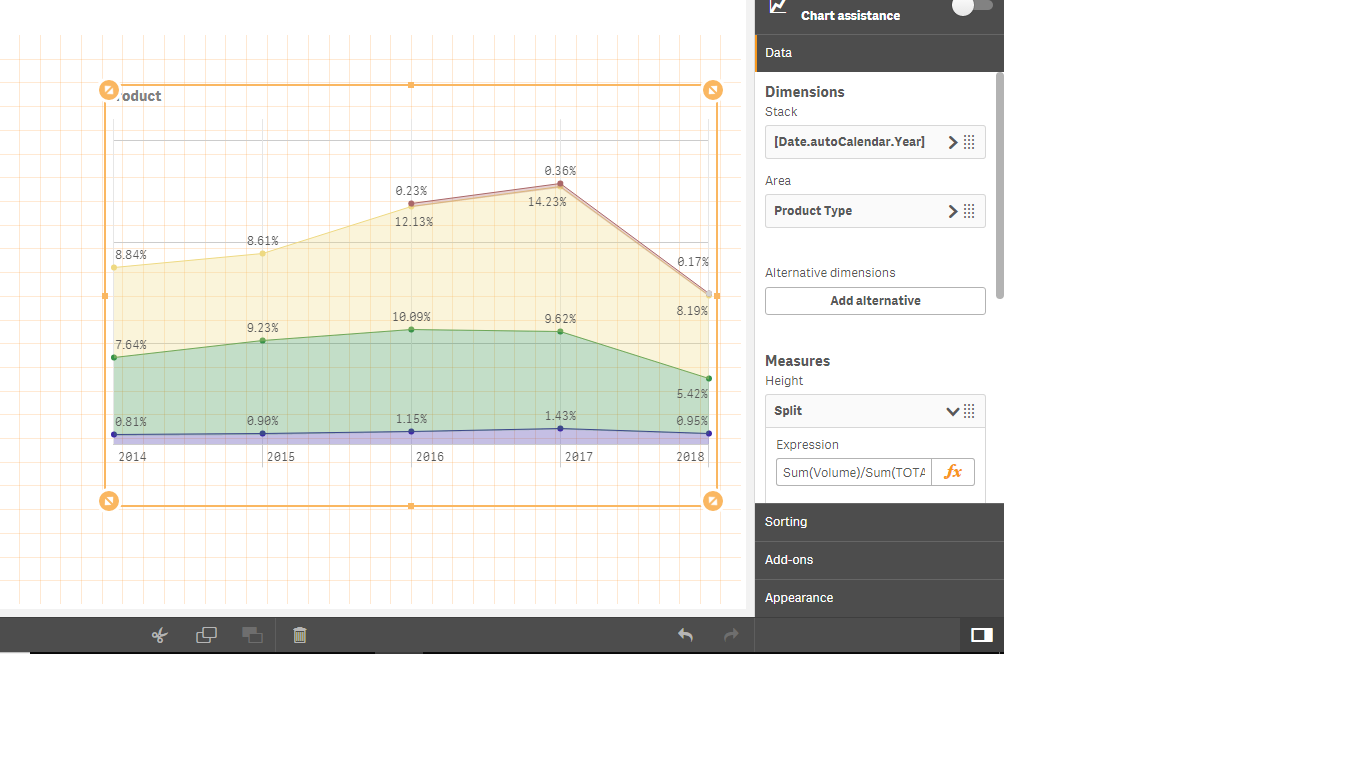 be
be
- Mark as New
- Bookmark
- Subscribe
- Mute
- Subscribe to RSS Feed
- Permalink
- Report Inappropriate Content
OK, so the dimension is not [Year], but [Date.autoCalendar.Year], which means the expression should be:
Sum([Volume])/Sum(TOTAL <Date.autoCalendar.Year> [Volume])
EDIT: I also changed [Sales Volume] to [Volume] according the screenshot.
- Mark as New
- Bookmark
- Subscribe
- Mute
- Subscribe to RSS Feed
- Permalink
- Report Inappropriate Content
I have used <Date.autoCalendar.Year> itself in my expression
- Mark as New
- Bookmark
- Subscribe
- Mute
- Subscribe to RSS Feed
- Permalink
- Report Inappropriate Content
Prod A share for 2014 is being calculated over total volume for all the years. This is the issue. It needs to be calculated over total vol for 2014 but it is not happening.
- Mark as New
- Bookmark
- Subscribe
- Mute
- Subscribe to RSS Feed
- Permalink
- Report Inappropriate Content
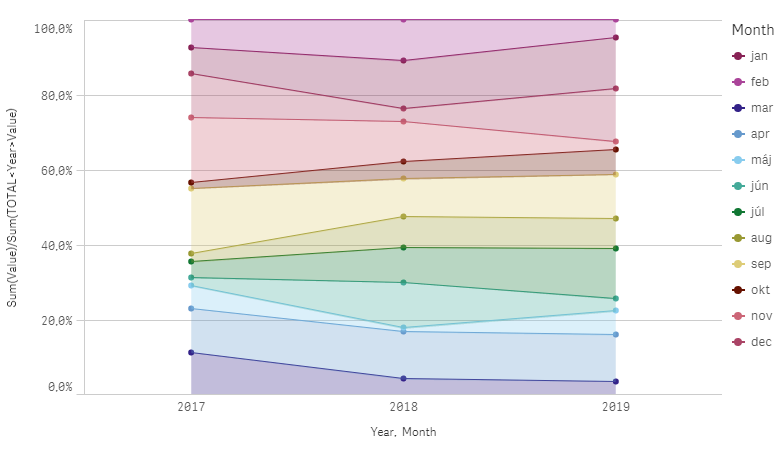
This is strange. It works for me nicely (I just used Month instead of Product, because I do not have Product in my sample app):
- Mark as New
- Bookmark
- Subscribe
- Mute
- Subscribe to RSS Feed
- Permalink
- Report Inappropriate Content
Then I dont know what is going wrong here. I will check this later and see if it works. Thank you for all your help Juraj.
Best Regards,
Rony