Unlock a world of possibilities! Login now and discover the exclusive benefits awaiting you.
- Qlik Community
- :
- Forums
- :
- Analytics
- :
- New to Qlik Analytics
- :
- Re: Importing Excel Data into a Table Chart
- Subscribe to RSS Feed
- Mark Topic as New
- Mark Topic as Read
- Float this Topic for Current User
- Bookmark
- Subscribe
- Mute
- Printer Friendly Page
- Mark as New
- Bookmark
- Subscribe
- Mute
- Subscribe to RSS Feed
- Permalink
- Report Inappropriate Content
Importing Excel Data into a Table Chart
Hi Everyone,
I am creating a dashboard for management and one of the requirements is that the raw data needs to be accessible. I am planing on creating a sheet in my Qlik App that has the raw data, and linking certain visualizations to it. Since the data is already loaded in Qlik I tried to recreate the spreadsheet manually by creating a Table chart and adding all of the columns. The issue with that is that there is a limit to how many columns can be displayed and horizontal scrolling is nonexistent. Is there a way to insert the Excel spreadsheet directly into a table and have all of the columns visible, including a horizontal scroll bar? I am using Qlik Sense 3.2 SR2.
- Tags:
- excel
- excel import
- Mark as New
- Bookmark
- Subscribe
- Mute
- Subscribe to RSS Feed
- Permalink
- Report Inappropriate Content
I am not aware of a limit. But there certainly could be. As you add more columns they will resize automatically to fit the resolution. So too many columns will begin to squeeze down in size. But there should be a scroll bar when that happens.
How many columns do you have?
I don't believe there is a way to just display the spreadsheet.
- Mark as New
- Bookmark
- Subscribe
- Mute
- Subscribe to RSS Feed
- Permalink
- Report Inappropriate Content
Hi Mark,
The spreadsheet I'm using has 28 columns.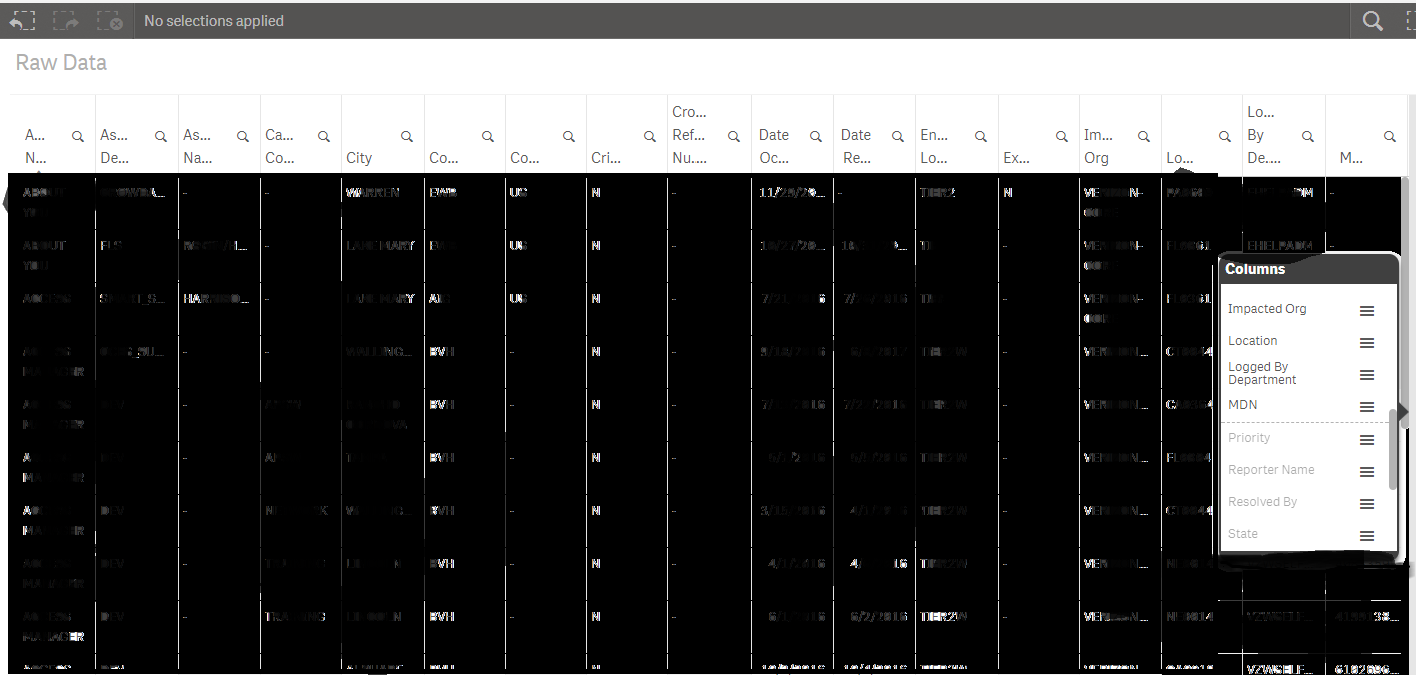
As you can see, at some point it stops presenting columns. In addition, you can't read the column headers. I know I can adjust the size of the column headers, but my biggest problem is being able to properly display all of the data.
- Mark as New
- Bookmark
- Subscribe
- Mute
- Subscribe to RSS Feed
- Permalink
- Report Inappropriate Content
No offense, but this doesn't pass the smell test. If someone demanded source data, I would just give them read-only access to a share of the Repository where the Excel file is loaded, and then let them do as they please. Sounds like someone doesn't want to let go of Excel.
- Mark as New
- Bookmark
- Subscribe
- Mute
- Subscribe to RSS Feed
- Permalink
- Report Inappropriate Content
Hi Mark,
I agree. Unfortunately some people are simply set in their ways. I will go with your suggestion.
Thanks.