Unlock a world of possibilities! Login now and discover the exclusive benefits awaiting you.
- Qlik Community
- :
- All Forums
- :
- Visualization and Usability
- :
- Love the Qlik Sense Pivot table but would love mor...
- Subscribe to RSS Feed
- Mark Topic as New
- Mark Topic as Read
- Float this Topic for Current User
- Bookmark
- Subscribe
- Mute
- Printer Friendly Page
- Mark as New
- Bookmark
- Subscribe
- Mute
- Subscribe to RSS Feed
- Permalink
- Report Inappropriate Content
Love the Qlik Sense Pivot table but would love more
Hi all,
What does everyone think of the Qlik Sense pivot table?
Really glad to see it included in Qlik Sense now but there are a few things I would like as well.
Let me know what you think:
1. Ability to make on selections or expand the row.
2. Export to Excel (I know the ideal is to do everything is to work within Qlik Sense).
3. Ability to disable rows\columns rather than delete them and also do this from analysis mode.
What do you think?
Mark
www.youtube.com/practicalqlik
www.amazon.com/Mark-ODonovan/e/B007QUFRQY
- « Previous Replies
-
- 1
- 2
- Next Replies »
Accepted Solutions
- Mark as New
- Bookmark
- Subscribe
- Mute
- Subscribe to RSS Feed
- Permalink
- Report Inappropriate Content
Hi Mark,
I'm really happy about the feedback and good that you enjoyed seeing it now part of our Qlik Sense product ![]()
Those 3 features are on our todo list together with some more funtionality. But if everyone could add what they want to see in an interactive pivot table it would be nice for us to make sure we capture all user requirements.
Regards,
Patrik
- Mark as New
- Bookmark
- Subscribe
- Mute
- Subscribe to RSS Feed
- Permalink
- Report Inappropriate Content
This is both suggestions for the PivotTable and the StraightTable
- Column width and height
- Inline graphs
- Show dimension as image
- Icons
- Mark as New
- Bookmark
- Subscribe
- Mute
- Subscribe to RSS Feed
- Permalink
- Report Inappropriate Content
Hi Patrik,
That's great news.
Thanks for the response.
Mark
- Mark as New
- Bookmark
- Subscribe
- Mute
- Subscribe to RSS Feed
- Permalink
- Report Inappropriate Content
I also love that Pivot Table has been added to Qlik Sense, but on the list of things that should be added, we should be able to add subtotals at whichever level(s) we require. It seems that right now we are locked into totals only on the primary dimension (or not at all).
- Mark as New
- Bookmark
- Subscribe
- Mute
- Subscribe to RSS Feed
- Permalink
- Report Inappropriate Content
Another suggestion would be to have totals for each column (not just sub-totals for each row). Thanks!
- Mark as New
- Bookmark
- Subscribe
- Mute
- Subscribe to RSS Feed
- Permalink
- Report Inappropriate Content
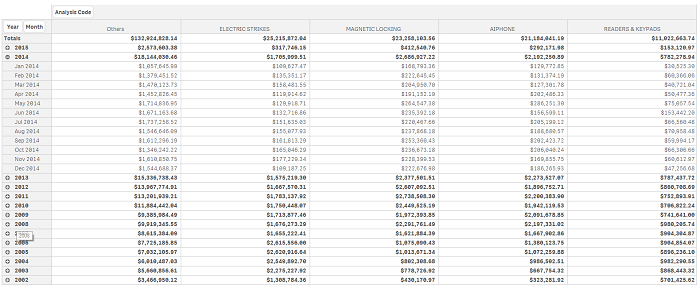
I think I have found a bug/oversight. When you add a column group, and select a limitation (say top 5), it won't show anything except others unless you expand the first dimensions.
To replicate:
Create three dimensions, Year, Month and Stock Group (or whatever). Add a single measure (say Sum(Amount)).
Move the last dimension down to columns, and set the limitation to fixed number. I'm using 5 as my example.
Now the chart only shows Others, until you expand one of the years:


- Mark as New
- Bookmark
- Subscribe
- Mute
- Subscribe to RSS Feed
- Permalink
- Report Inappropriate Content
Hi Shane,
We've verified it as a bug and it was fixed internally yesterday and will be part of the next release.
Thanks for reporting it!
Regards,
Patrik
- Mark as New
- Bookmark
- Subscribe
- Mute
- Subscribe to RSS Feed
- Permalink
- Report Inappropriate Content
Ty all,
Also if it is possible to disdide in wich side the pivot direction-
right to left or left to right
altough its no in qlik view
- Mark as New
- Bookmark
- Subscribe
- Mute
- Subscribe to RSS Feed
- Permalink
- Report Inappropriate Content
Adding my 2 cents - and I apologize in advance for some repeats:
- Export to Excel, while already mentioned, is a high priority for us.
- Sort by clicking any row header
- Adjust column widths (even allowing us to give a % of screen size per column would help)
- Fix export to PDF (which is currently just a screen shot)
- « Previous Replies
-
- 1
- 2
- Next Replies »