Unlock a world of possibilities! Login now and discover the exclusive benefits awaiting you.
- Qlik Community
- :
- Forums
- :
- Analytics
- :
- New to Qlik Analytics
- :
- Re: Match Rate in Bar chart
- Subscribe to RSS Feed
- Mark Topic as New
- Mark Topic as Read
- Float this Topic for Current User
- Bookmark
- Subscribe
- Mute
- Printer Friendly Page
- Mark as New
- Bookmark
- Subscribe
- Mute
- Subscribe to RSS Feed
- Permalink
- Report Inappropriate Content
Match Rate in Bar chart
Hello Experts,
I am new to Qlik world!
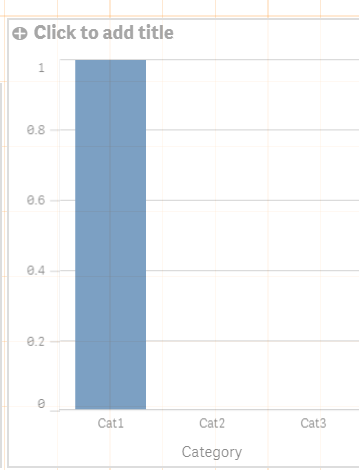
Trying to create a bar chart where it will show match rate (%) for each of categories.
Sample Data:
| ID | Category | Source | dest | Status |
| 1 | Cat1 | A | A | Match |
| 2 | Cat2 | B | b | not match |
| 3 | Cat1 | A | a | not match |
| 4 | Cat1 | CC | CC | Match |
| 5 | Cat3 | d | D | not match |
Source and dest fields are coming from two different databases(both are Postgres in this case)
I tried to create chart by adding 'Category' as Dimension where each Category and its match rate is represented as bar.
I tried to create below measure but it doesn't show any results.
count({$ <Source= dest>}[Category])/count([Category])
Any suggestions?
Thanks,
Naveen
Accepted Solutions
- Mark as New
- Bookmark
- Subscribe
- Mute
- Subscribe to RSS Feed
- Permalink
- Report Inappropriate Content
- Mark as New
- Bookmark
- Subscribe
- Mute
- Subscribe to RSS Feed
- Permalink
- Report Inappropriate Content
Try
count(if(Source=dest,Category))/count(Category)
- Mark as New
- Bookmark
- Subscribe
- Mute
- Subscribe to RSS Feed
- Permalink
- Report Inappropriate Content
If you want to only count the category once then try this
Count(Distinct{$<Status={"Match"}>}Category)/Count(Distinct Category)
Test2:
LOAD * INLINE [
ID, Category, Source, dest, Status
1, Cat1, A,A, Match
2, Cat2, B,b, not match
3, Cat1, A,a, not match
4, Cat1, CC, CC, Match
5, Cat3, d,D, not match
];
- Mark as New
- Bookmark
- Subscribe
- Mute
- Subscribe to RSS Feed
- Permalink
- Report Inappropriate Content
Hi,
Try like this,
count({$<Source= p(dest)>}[Category]) / count([Category])
Regards,
- Mark as New
- Bookmark
- Subscribe
- Mute
- Subscribe to RSS Feed
- Permalink
- Report Inappropriate Content
It works! Thanks Micheal!