Unlock a world of possibilities! Login now and discover the exclusive benefits awaiting you.
- Qlik Community
- :
- Forums
- :
- Analytics
- :
- New to Qlik Analytics
- :
- Missing dates and referencing date dimension row
- Subscribe to RSS Feed
- Mark Topic as New
- Mark Topic as Read
- Float this Topic for Current User
- Bookmark
- Subscribe
- Mute
- Printer Friendly Page
- Mark as New
- Bookmark
- Subscribe
- Mute
- Subscribe to RSS Feed
- Permalink
- Report Inappropriate Content
Missing dates and referencing date dimension row
Please help, I'm new to Qlik Sense but see that it could be very useful. But I feel I'm missing something fundamental.
Say I have a simple fact table as follows that shows 3 customers with their start and end dates as well as the rate they pay...
Fact:
LOAD * INLINE [
Customer,StartDate,EndDate,Rate
A,2/24/2018,6/20/2018,100
B,4/1/2018,7/4/2018,200
C,5/6/2018,,300
];
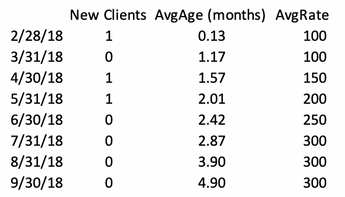
How can I create a chart that looks like the following....
I'm running into the following 2 problems.
- I'm not getting an exhaustive list of dates, I'm only getting the dates from either column and when I try to set up a master calendar, I believe I'm setting it up wrong as the data is linked to the dates in the new calendar.
- How can I reference the date dimension? For instance, for the AvgAge measure I'm thinking I would need a formula like this....
Avg(IF(StartDate < CURRENT_ROW_DATE and EndDate > CURRENT_ROW_DATE, (CURRENT_ROW_DATE -StartDate)/30 ))
So how can I reference the date dimension current row like I would need in the pseudo code above (CURRENT_ROW_DATE)?Or am I just thinking of this completely wrong?
If anyone could please help it would be GREATLY appreciated as I'm thoroughly confused....
- Tags:
- master calendar
Accepted Solutions
- Mark as New
- Bookmark
- Subscribe
- Mute
- Subscribe to RSS Feed
- Permalink
- Report Inappropriate Content
This is not a trivial problem. You must generate the list of dates, find which clients are active in different periods and calculate the age for them. After that the expressions will be simple 🙂 Maybe something like this:
Fact:
LOAD
Customer,
StartDate,
date(if(isnull(EndDate) or trim(EndDate)='',today(),EndDate)) as EndDate,
Rate
INLINE [
Customer,StartDate,EndDate,Rate
A,2/24/2020,6/20/2020,100
B,4/1/2020,7/4/2020,200
C,5/6/2020,,300
];
MinMax:
Load
num(monthstart(min(fieldvalue('StartDate',recno())))) as MinDate,
floor(monthend(max(fieldvalue('EndDate',recno())))) as MaxDate
AutoGenerate fieldvaluecount('StartDate');
Let vMinDate = peek('MinDate',-1);
Let vMaxDate = peek('MaxDate',-1);
drop table MinMax;
Dates:
Load
date(floor(monthend(addmonths($(vMinDate),iterno()-2)))) as Date
AutoGenerate(1) while addmonths($(vMinDate),iterno()-2)<$(vMaxDate);
inner join (Fact)
intervalmatch(Date) Load distinct StartDate, EndDate resident Fact;
drop table Dates;
Fact2:
Load
*,
if(InMonth(StartDate,Date,0),1,0) as FlagNewClient,
((year(Date)*12)+month(Date)) - (((year(StartDate)*12)+month(StartDate))) as AgeMonths
resident Fact;
Drop table Fact;
Expression New Clients: Sum(FlagNewClient)
Expression Avg Age: avg(AgeMonths)
Morgan Kejerhag
Senior Business Intelligence Consultant
Drake Analytics
http://www.drakeanalytics.se
- Mark as New
- Bookmark
- Subscribe
- Mute
- Subscribe to RSS Feed
- Permalink
- Report Inappropriate Content
Thank you morgankejerhag! Your solution works beautifully.
One follow up though....apart from handling this in the load script (which your solution does perfectly), could I have created an expression that can count all "live" clients for any month (StartDate < current row date and Exit date > current row date). Perhaps this would require set analysis?

