Unlock a world of possibilities! Login now and discover the exclusive benefits awaiting you.
- Qlik Community
- :
- Forums
- :
- Analytics
- :
- New to Qlik Analytics
- :
- Re: Multiple lines on line chart
- Subscribe to RSS Feed
- Mark Topic as New
- Mark Topic as Read
- Float this Topic for Current User
- Bookmark
- Subscribe
- Mute
- Printer Friendly Page
- Mark as New
- Bookmark
- Subscribe
- Mute
- Subscribe to RSS Feed
- Permalink
- Report Inappropriate Content
Multiple lines on line chart
Hi,
In my dimension I should see the days from the beginning of the year to the max date.
I want to have 3 lines on line chart. One line should calculate the sum of sales in 2016, another line for 2017 etc
I have date format like this
Jan 1 , Feb 1 ...
My chart should look like this
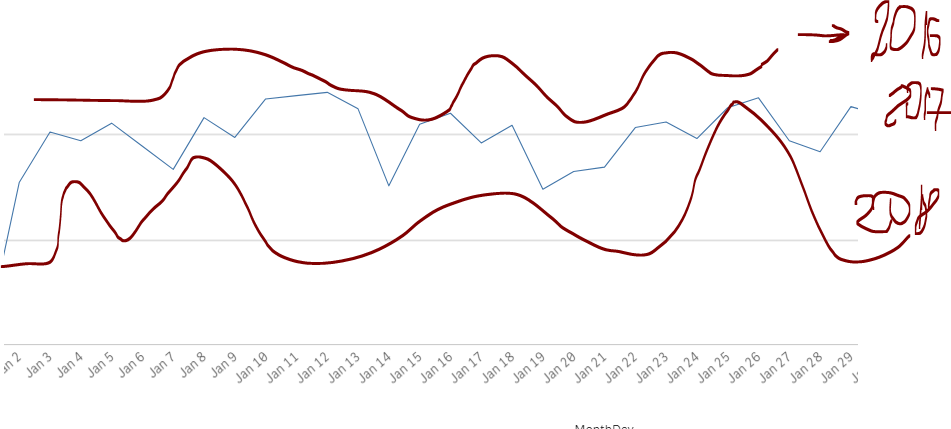
is it possible?
I calculate the sum of sales in 2018 using this formula: SUM({$<Year = {'$(=Max(Year))'}, Month =, Quarter = , date = >}FactSoldAmount)
When I add another dimension for the previous year SUM({$<Year = {'$(=Max(Year)-1)'}, Month =, Quarter = , date = >}FactSoldAmount) lines aren't shown together. At first I see sum of sales in 2017 from January to April, and then I see sum of sales in 2018 from January to April
- « Previous Replies
-
- 1
- 2
- Next Replies »
Accepted Solutions
- Mark as New
- Bookmark
- Subscribe
- Mute
- Subscribe to RSS Feed
- Permalink
- Report Inappropriate Content
You can also create a field named DayYearNoYTD:
If( DayNumberOfYear(Today(1))>DayNumberOfYear(Date) , Dual(Date(Date,'MMM D'),DayNumberOfYear(Date)) , Null()) AS YearDayNoYTD
And then in your line chart turn off "Include Null Values" for the dimension DayYearNoYTD:
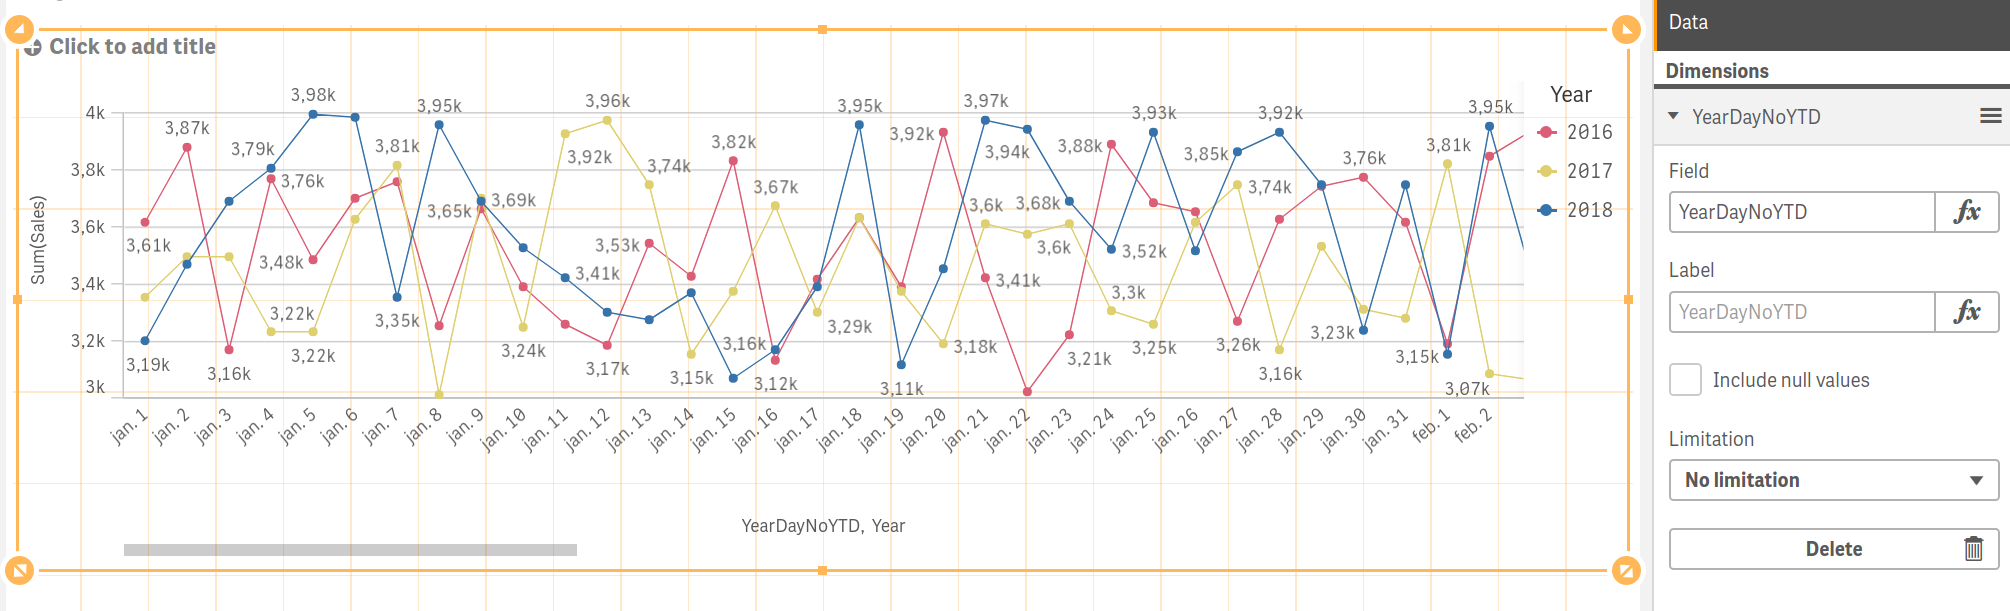
And then have simply Sum(Sales) as the expression
- Mark as New
- Bookmark
- Subscribe
- Mute
- Subscribe to RSS Feed
- Permalink
- Report Inappropriate Content
Add two dimensions: Month and Year and simply one measure without set expression: Sum(Sales)
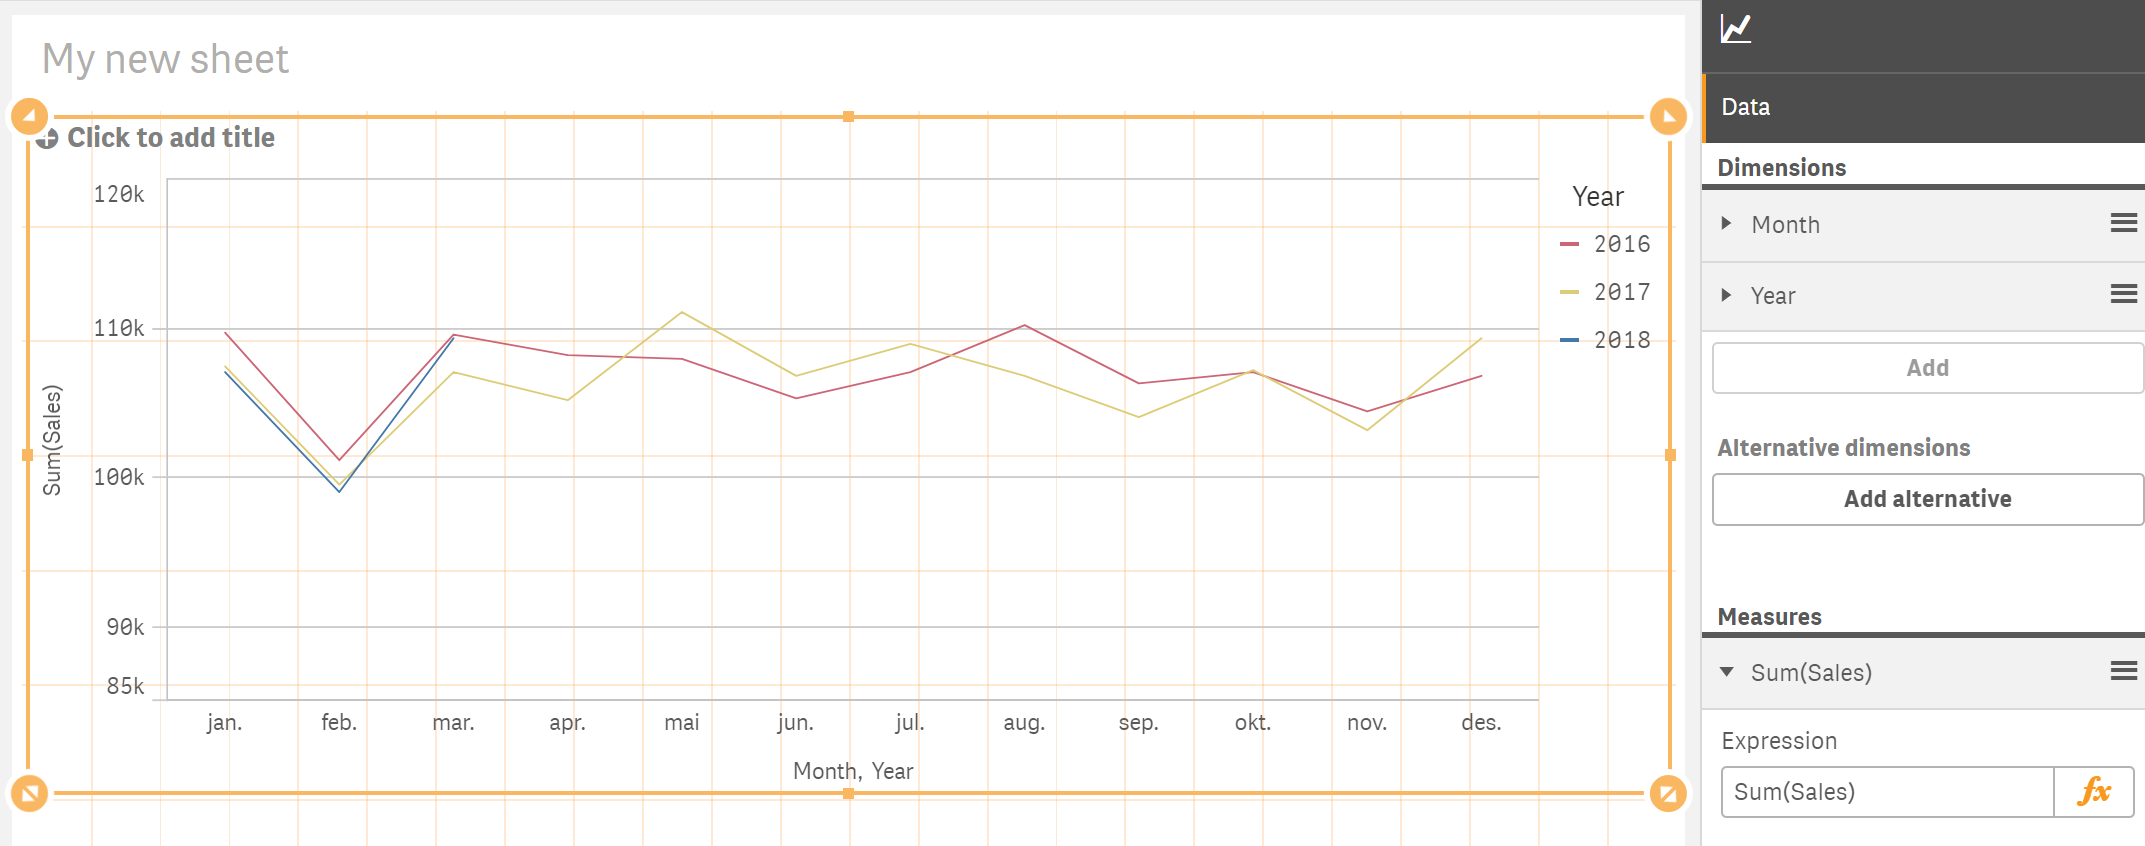
Or the measure: Sales( {<Quarter=,Month=>} Sales)
Or: Sales( {<Year={$(=Max(Year)),$(=Max(Year)-1),$(=Max(Year)-2)},Quarter=,Month=>} Sales)
- Mark as New
- Bookmark
- Subscribe
- Mute
- Subscribe to RSS Feed
- Permalink
- Report Inappropriate Content
But I want to show the sum of sales only the period ( from the beginning of the year to the max date information)
In my script I have ----- Date(date,'MMM D') as MonthDay
and I use MonthDay in dimension.When I add year it doesn't show the sum of sales in these 3 years
- Mark as New
- Bookmark
- Subscribe
- Mute
- Subscribe to RSS Feed
- Permalink
- Report Inappropriate Content
Then just use MonthDay instead of Month and try what I suggested.
- Mark as New
- Bookmark
- Subscribe
- Mute
- Subscribe to RSS Feed
- Permalink
- Report Inappropriate Content
You should only have one measure. The addition of Year as a dimension is only possible if you have one measure. So you will end up with two dimensions and one measure. The aggregations (Sum, Count,Avg .... etc) should always be added as measures.
- Mark as New
- Bookmark
- Subscribe
- Mute
- Subscribe to RSS Feed
- Permalink
- Report Inappropriate Content
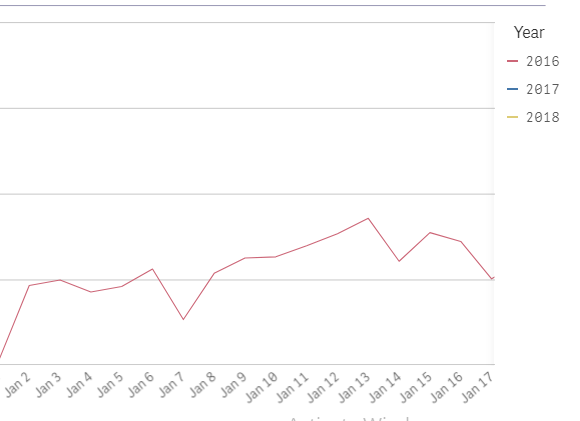
Lines aren't shown together again 
Measure : SUM({$<Year={$(=Max(Year)),$(=Max(Year)-1),$(=Max(Year)-2)}, Month =, Quarter = , date = >}Sale)
Dimension: MonthDay, Year
- Mark as New
- Bookmark
- Subscribe
- Mute
- Subscribe to RSS Feed
- Permalink
- Report Inappropriate Content
It works well for me:
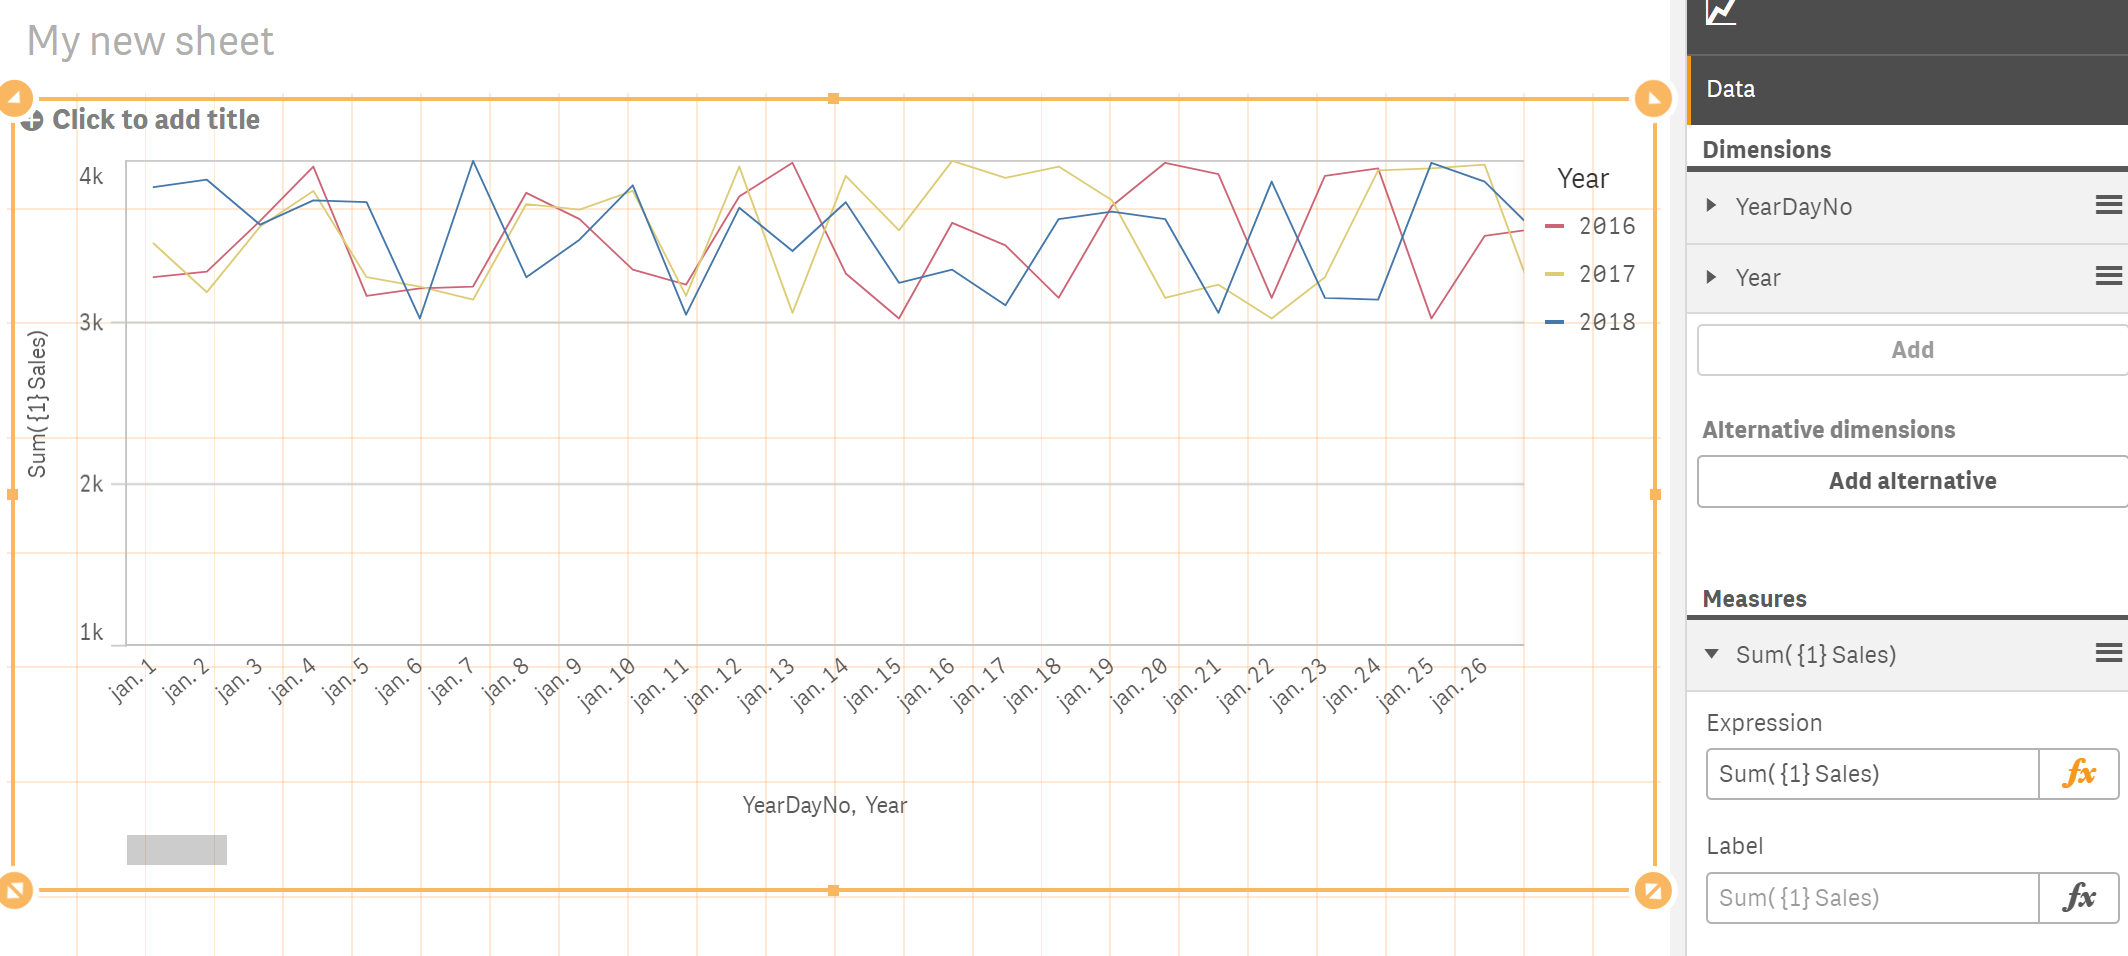
YearDayNo has been calculated in the load script as:
Dual(Date(Date,'MMM D'),DayNumberOfYear(Date)) AS YearDayNo
- Mark as New
- Bookmark
- Subscribe
- Mute
- Subscribe to RSS Feed
- Permalink
- Report Inappropriate Content
I only have one measure :
Measure : SUM({$<Year={$(=Max(Year)),$(=Max(Year)-1),$(=Max(Year)-2)}, Month =, Quarter = , date = >}Sale)
and Two dimensions :
Dimension: MonthDay, Year
- Mark as New
- Bookmark
- Subscribe
- Mute
- Subscribe to RSS Feed
- Permalink
- Report Inappropriate Content
It works for me too
But it doesn't show only the day from January to Max date information ( April)
- Mark as New
- Bookmark
- Subscribe
- Mute
- Subscribe to RSS Feed
- Permalink
- Report Inappropriate Content
I did it
I used dimension: YearDayNo
And my measures are : sum({$<Year = {$(=max(Year))}>}Sales) for 2018
=Sum({$<Date = {">=$(=YearStart(AddYears(Max(date), -1)))<=$(=MonthEnd(AddYears(Max(date), -1)))"}>}Sales) for 2017
=Sum({$<Date = {">=$(=YearStart(AddYears(Max(date), -2)))<=$(=MonthEnd(AddYears(Max(date), -2)))"}>}Sales) for 2016
- « Previous Replies
-
- 1
- 2
- Next Replies »