Unlock a world of possibilities! Login now and discover the exclusive benefits awaiting you.
- Qlik Community
- :
- Forums
- :
- Analytics
- :
- New to Qlik Analytics
- :
- Re: Pie Chart with Measure within the Dimension
- Subscribe to RSS Feed
- Mark Topic as New
- Mark Topic as Read
- Float this Topic for Current User
- Bookmark
- Subscribe
- Mute
- Printer Friendly Page
- Mark as New
- Bookmark
- Subscribe
- Mute
- Subscribe to RSS Feed
- Permalink
- Report Inappropriate Content
Pie Chart with Measure within the Dimension
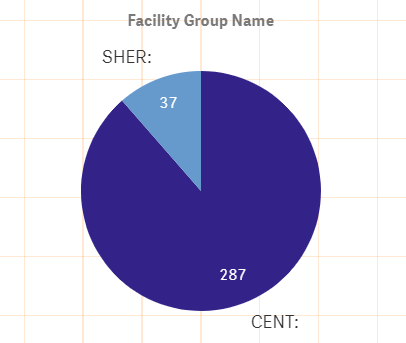
I am attempting to display a pie chart that has the count within the pie chart and then the % as part of my dimension. For example, if SHER has a count of 37 and CENT has a could of 287, I would want the pie chart to display those values within the chart and then the labels say SHER: 11.4% and CENT: 88.6%. However, I am not having any luck at achieving this.
My measure is as follows: Sum(Aggr(If(Sum({$<RenFlag = {1}, SurgeryFlag = {1}, [_R12M] = {1}, TJFlag = {0}, [Rendering Doctor Name] = {'Test, Provider'}, SurgAssistFlag = {1}>} Units)>0, 1, 0), Key|Surgery, [Rendering Doctor Name], [Invoice Date]))
My dimension is: [Facility Group Name]

- Subscribe by Topic:
-
Advanced visualization
-
pie chart
-
pie chart and percentage
-
Piechart
-
Set Analysis
Accepted Solutions
- Mark as New
- Bookmark
- Subscribe
- Mute
- Subscribe to RSS Feed
- Permalink
- Report Inappropriate Content
May be this as your dimension
Aggr(

[Facility Group Name]
& ': ' &
Num(Sum(Aggr(If(Sum({$<RenFlag = {1}, SurgeryFlag = {1}, [_R12M] = {1}, TJFlag = {0}, [Rendering Doctor Name] = {'Test, Provider'}, SurgAssistFlag = {1}>} Units)>0, 1, 0), Key|Surgery, [Rendering Doctor Name], [Invoice Date]))/Sum(TOTAL Aggr(If(Sum({$<RenFlag = {1}, SurgeryFlag = {1}, [_R12M] = {1}, TJFlag = {0}, [Rendering Doctor Name] = {'Test, Provider'}, SurgAssistFlag = {1}>} Units)>0, 1, 0), Key|Surgery, [Rendering Doctor Name], [Invoice Date])), '##.#%')

, [Facility Group Name])- Mark as New
- Bookmark
- Subscribe
- Mute
- Subscribe to RSS Feed
- Permalink
- Report Inappropriate Content
Thank you so much, this is perfect!