Unlock a world of possibilities! Login now and discover the exclusive benefits awaiting you.
- Qlik Community
- :
- Forums
- :
- Analytics
- :
- New to Qlik Analytics
- :
- Re: Previous Month for Current Year
- Subscribe to RSS Feed
- Mark Topic as New
- Mark Topic as Read
- Float this Topic for Current User
- Bookmark
- Subscribe
- Mute
- Printer Friendly Page
- Mark as New
- Bookmark
- Subscribe
- Mute
- Subscribe to RSS Feed
- Permalink
- Report Inappropriate Content
Previous Month for Current Year
I wanted to show 2 line chart
1.current year current month
2.current year previous month.
Dimension:Month
My current Year current month expression is
sum({<type={'Order'},FiscalYear={$(=max(FiscalYear))}>} Sales) (works fine)
My current Year previous month expression is
=(above(Sum({<type={'Order'},FiscalYear={$(=max(FiscalYear))}>}Sales ))) (issue)
If I use above expression till may (right to left) I am getting precise value ,however apr is null,
Can any one help me?
- Tags:
- previous month
- « Previous Replies
-
- 1
- 2
- Next Replies »
- Mark as New
- Bookmark
- Subscribe
- Mute
- Subscribe to RSS Feed
- Permalink
- Report Inappropriate Content
I would recommend reading this :Calculating rolling n-period totals, averages or other aggregations and Accumulative Sums, which would actually help you learn the trick of using aggr() along with set analysis to deal with such issues.
- Mark as New
- Bookmark
- Subscribe
- Mute
- Subscribe to RSS Feed
- Permalink
- Report Inappropriate Content
Based on this FiscalYear={$(=max(FiscalYear))} your Fiscal year is ended in May i guess. so it wont get the Apr.
Do you have a FiscalYear_Month field ---- 2014-04?? or in number format like 40567??
prefer to have number format...makes life easier in set analysis...if u dont have in number format create one in your script...say DateKey
create a variable called "vPriorRolling12"
='>='&floor(addmonths(max(DateKey),-13))&'<='&floor(addmonths(max(DateKey),-1))
sum({<type={'Order'},DateKey={'$(vPriorRolling12)'}>} Sales)
if this doesn't work, share your QVF and i will take a look.
- Mark as New
- Bookmark
- Subscribe
- Mute
- Subscribe to RSS Feed
- Permalink
- Report Inappropriate Content
First Thank you
My Fiscal Year starts from apr to end by mar
Let me explain clearly
In Line chart 
current month apr(2015) ->mar(2014) previous month ,
current month may(2015) ->apr(2014) previous month ,
current month jun(2015) ->may(2014) previous month
- Mark as New
- Bookmark
- Subscribe
- Mute
- Subscribe to RSS Feed
- Permalink
- Report Inappropriate Content
gwassenaar Can you please help me?
- Mark as New
- Bookmark
- Subscribe
- Mute
- Subscribe to RSS Feed
- Permalink
- Report Inappropriate Content
Could you upload your sample qvw?
- Mark as New
- Bookmark
- Subscribe
- Mute
- Subscribe to RSS Feed
- Permalink
- Report Inappropriate Content
I don't understand what you want to show in your line chart. If you use month as dimension then the value of the current month is one value so you get a point in the chart, not a line. The same for the previous month.
talk is cheap, supply exceeds demand
- Mark as New
- Bookmark
- Subscribe
- Mute
- Subscribe to RSS Feed
- Permalink
- Report Inappropriate Content
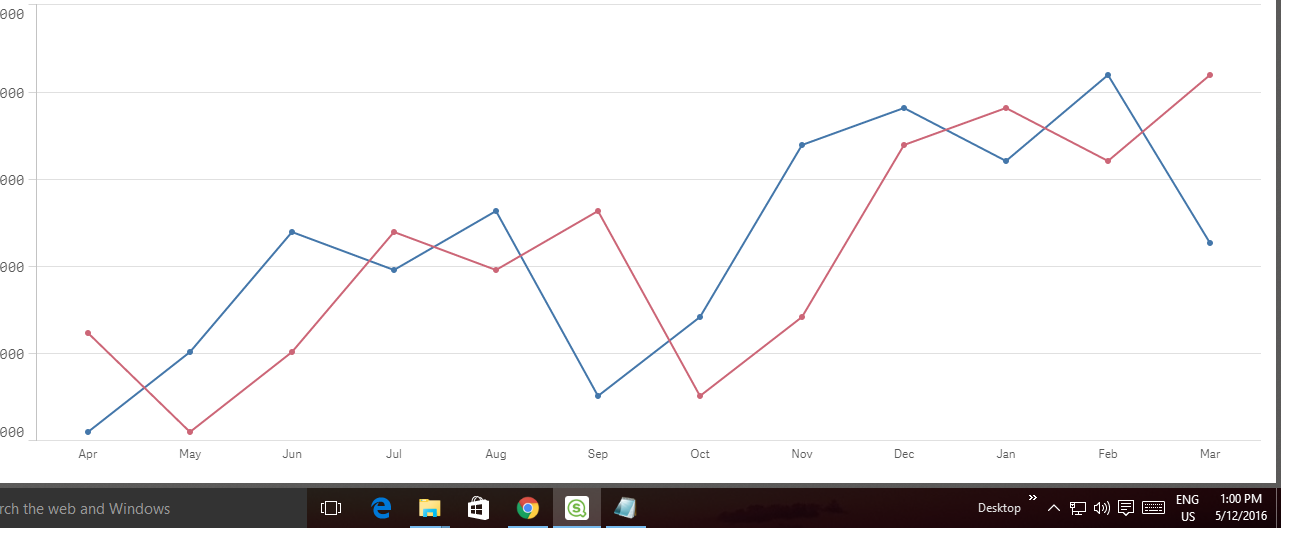
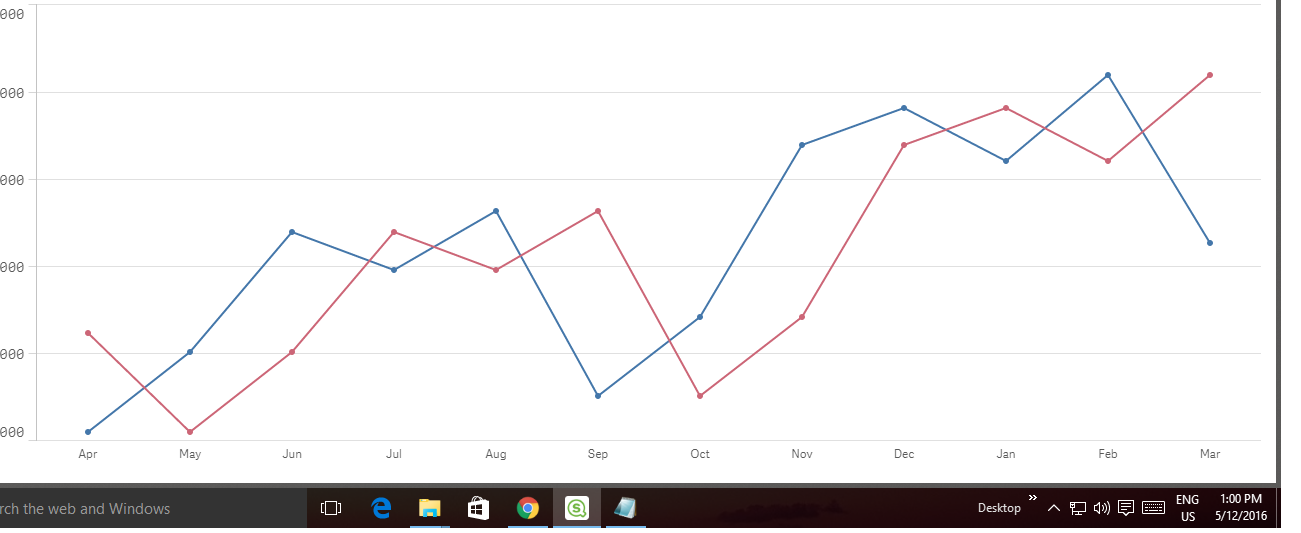
Sorry ,not current month
Actually I need values for all fiscal months for current fiscal year in one line chart
Another line chart is previous months of same year value should be shown to corresponding current year line chart.
Totally two line chart .
Output should be like this

please probe more if you don't understand?
- Mark as New
- Bookmark
- Subscribe
- Mute
- Subscribe to RSS Feed
- Permalink
- Report Inappropriate Content
Perhaps like this:
sum({<FiscalYear={$(=max(FiscalYear))}>} aggr(above(total sum({<type={'Order'}>} Sales)),FiscalYear,Month))
talk is cheap, supply exceeds demand
- Mark as New
- Bookmark
- Subscribe
- Mute
- Subscribe to RSS Feed
- Permalink
- Report Inappropriate Content
Thank you it's working fine for Month.
I have set up drill down for Dimension by Month-> DAY.
For Month it works fine.
IF I drill down to Day all values are '0's.
Any solution please?
- « Previous Replies
-
- 1
- 2
- Next Replies »