Unlock a world of possibilities! Login now and discover the exclusive benefits awaiting you.
- Qlik Community
- :
- Forums
- :
- Analytics
- :
- New to Qlik Analytics
- :
- Re: Qlik Sense - Bar Chart - change bar color base...
- Subscribe to RSS Feed
- Mark Topic as New
- Mark Topic as Read
- Float this Topic for Current User
- Bookmark
- Subscribe
- Mute
- Printer Friendly Page
- Mark as New
- Bookmark
- Subscribe
- Mute
- Subscribe to RSS Feed
- Permalink
- Report Inappropriate Content
Qlik Sense - Bar Chart - change bar color based on Column name
Hello,
I have a bar chart, and 2 table columns with figures.
How can I manually choose color for each of bars?
Load * Inline [
month, bar1, bar2
1, 10, 12
2, 13, 15
3, 12, 17
];
I'm looking for expression like =if(FieldName='bar1', rgb(87,87,150), rgb(150,100,100) )
But there is no function to get fieldname (column name) in Sense, right?
So, how can we solve the problem?
- « Previous Replies
-
- 1
- 2
- Next Replies »
- Mark as New
- Bookmark
- Subscribe
- Mute
- Subscribe to RSS Feed
- Permalink
- Report Inappropriate Content
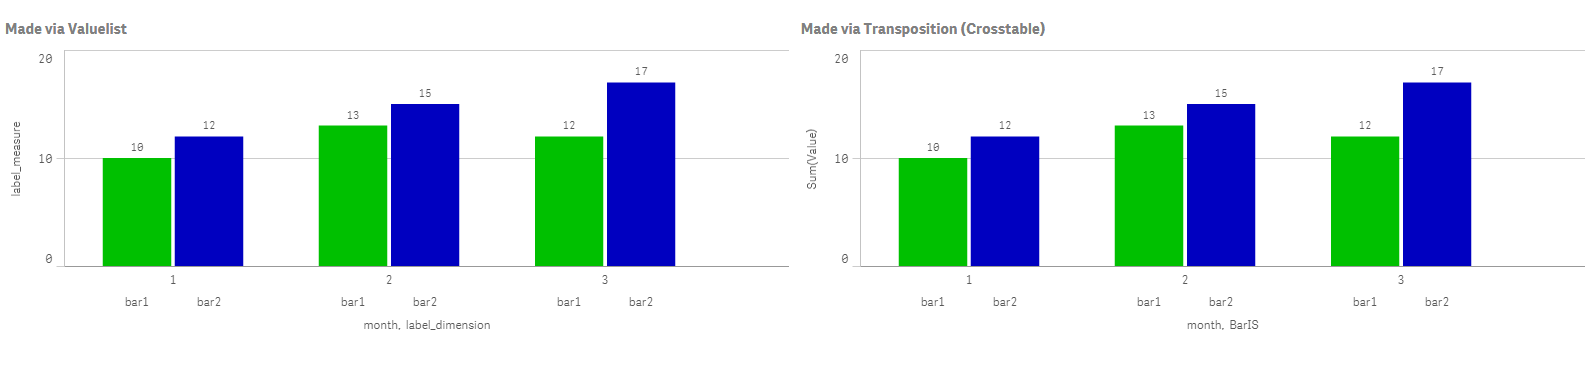
OK guys both variants work.
As mohitd910 gave a ValueList version (w/o changes made to existing table) and described limitation of that methods, his answer was chosen as a correct one.
But I suppose its better to create a separate table for a particular chart and transpose it in order to make it easier to modify the look of that chart (sorting, colors)....
Its a petty thou we cant use FieldName for some reasons in Sense...
thanks again!
- Mark as New
- Bookmark
- Subscribe
- Mute
- Subscribe to RSS Feed
- Permalink
- Report Inappropriate Content
To me the easiest way to give color to a bar in bar chart is to convert the measure into master measure and give it the color you want.
- Mark as New
- Bookmark
- Subscribe
- Mute
- Subscribe to RSS Feed
- Permalink
- Report Inappropriate Content
BRILLIANT IDEA - do you have a step by step process on how to do this please im very new
- Mark as New
- Bookmark
- Subscribe
- Mute
- Subscribe to RSS Feed
- Permalink
- Report Inappropriate Content
That is a very swift way to do it, Thanks!
IMHO QS should really allow more such simple configurations to be realised by clicking (and it is called Qlik!) instead of unnecessary syntaxing.
- Mark as New
- Bookmark
- Subscribe
- Mute
- Subscribe to RSS Feed
- Permalink
- Report Inappropriate Content
Hi @Poppel and @publication1 , idk if it will help now, but please find the steps below whcih i was suggesting.

- « Previous Replies
-
- 1
- 2
- Next Replies »