Unlock a world of possibilities! Login now and discover the exclusive benefits awaiting you.
- Qlik Community
- :
- All Forums
- :
- Visualization and Usability
- :
- Re: Qlik Sense Map Geo Points
- Subscribe to RSS Feed
- Mark Topic as New
- Mark Topic as Read
- Float this Topic for Current User
- Bookmark
- Subscribe
- Mute
- Printer Friendly Page
- Mark as New
- Bookmark
- Subscribe
- Mute
- Subscribe to RSS Feed
- Permalink
- Report Inappropriate Content
Qlik Sense Map Geo Points
Hi,
I have seen this video Qlik Sense 3.1 - Understanding Geographic Data Profiling - YouTube from @Michael Tarallo
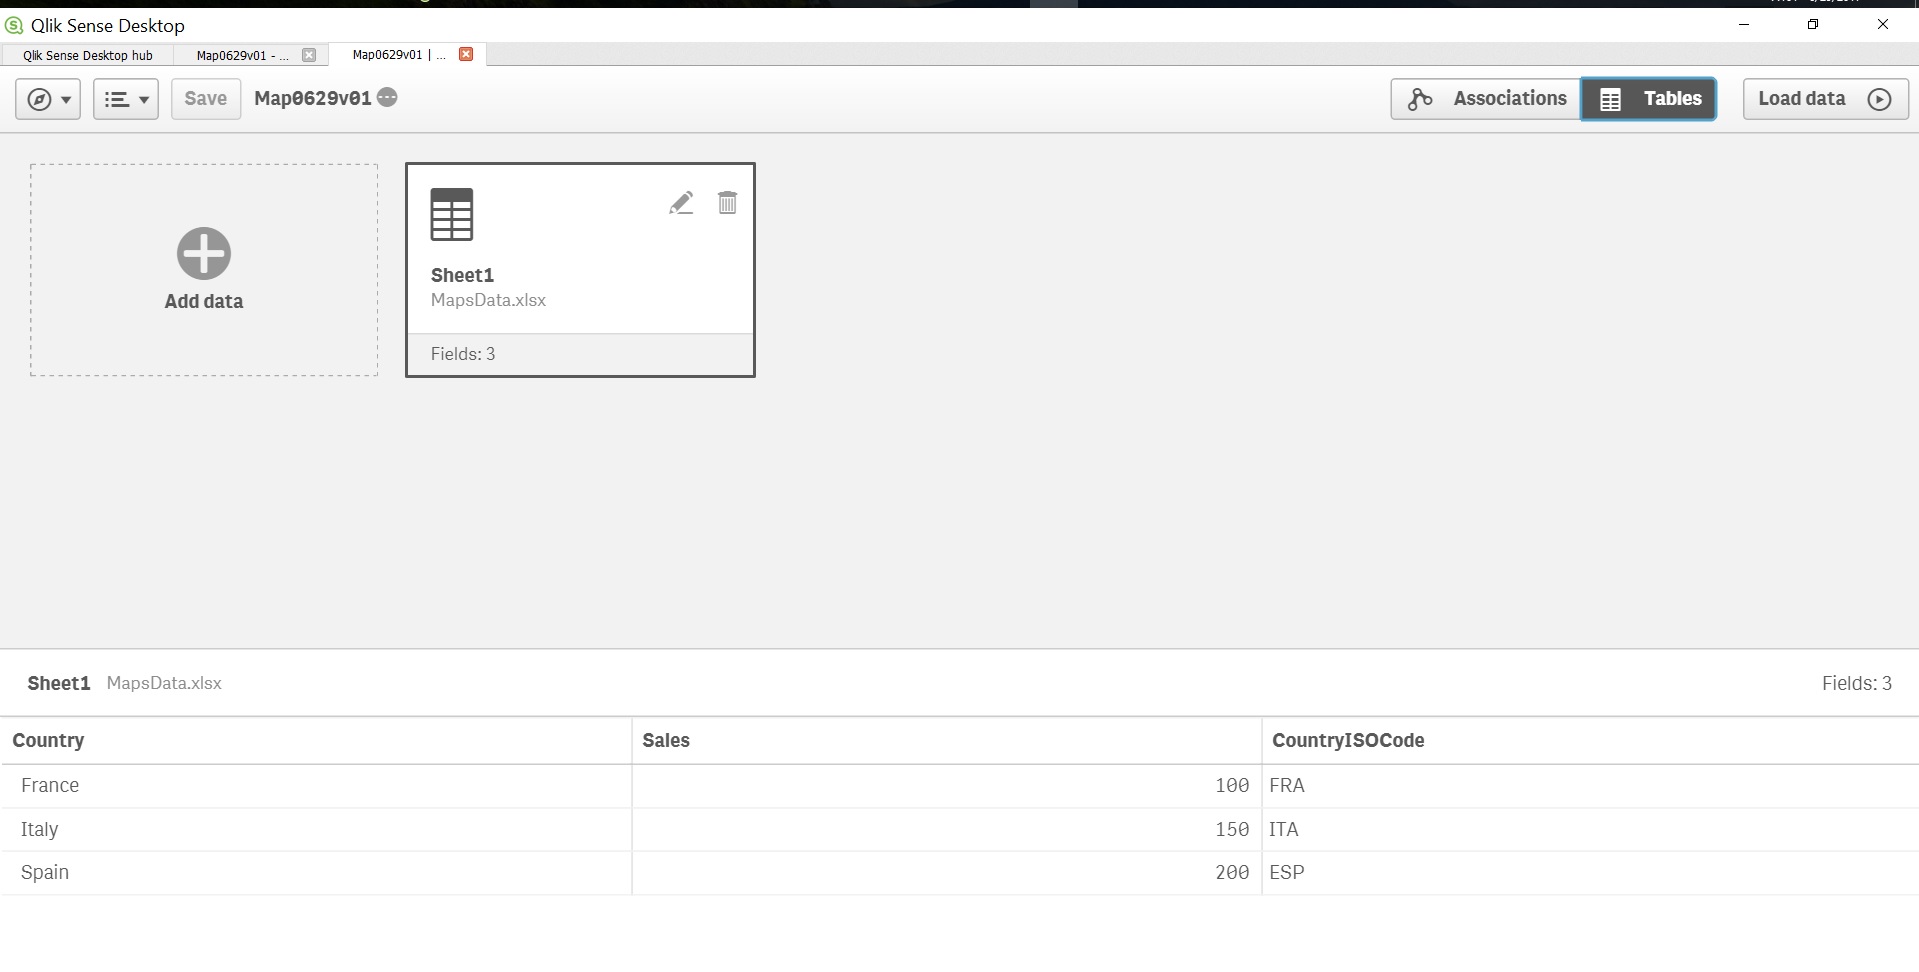
It says that Sense automatically generates geo points. I have tried this function with my Sense Desktop (3.1 SR6 latest version), but I haven't found any geo points after the data loading process.
My data is the following read from xlsx:
| Country | Sales |
| French | 100 |
| Italy | 150 |
| Spain | 200 |
qvf is attached.
thanks,
Daniel
- Tags:
- geo point
- Mark as New
- Bookmark
- Subscribe
- Mute
- Subscribe to RSS Feed
- Permalink
- Report Inappropriate Content
Thanks,
appreciate your help, but the main point here for me was QlikSense can 'translate' country code for example Hungary to geopoints and draw maps, without any function and data modification.
In Tableau you can do it....
- Mark as New
- Bookmark
- Subscribe
- Mute
- Subscribe to RSS Feed
- Permalink
- Report Inappropriate Content
hi
Data profiling only happen of you load the data using the data manager
not if you load via the script editor
hope that helps
- Mark as New
- Bookmark
- Subscribe
- Mute
- Subscribe to RSS Feed
- Permalink
- Report Inappropriate Content
At present , there is no function required in Qliksense for rendering a map, it requires an additional field country code. May be Qlik can come out with a similar feature available with other vendors in future.
thanks.
- Mark as New
- Bookmark
- Subscribe
- Mute
- Subscribe to RSS Feed
- Permalink
- Report Inappropriate Content
Tried with Country Code + ISO3 but it doesn't work

- Mark as New
- Bookmark
- Subscribe
- Mute
- Subscribe to RSS Feed
- Permalink
- Report Inappropriate Content
Ok, it seems that I solved my question after 2 days.
So if you click on prepare data during the load it'll works just based on COUNTRY NAME but if you click on that screen load and finish or directly load your xls it wont work.
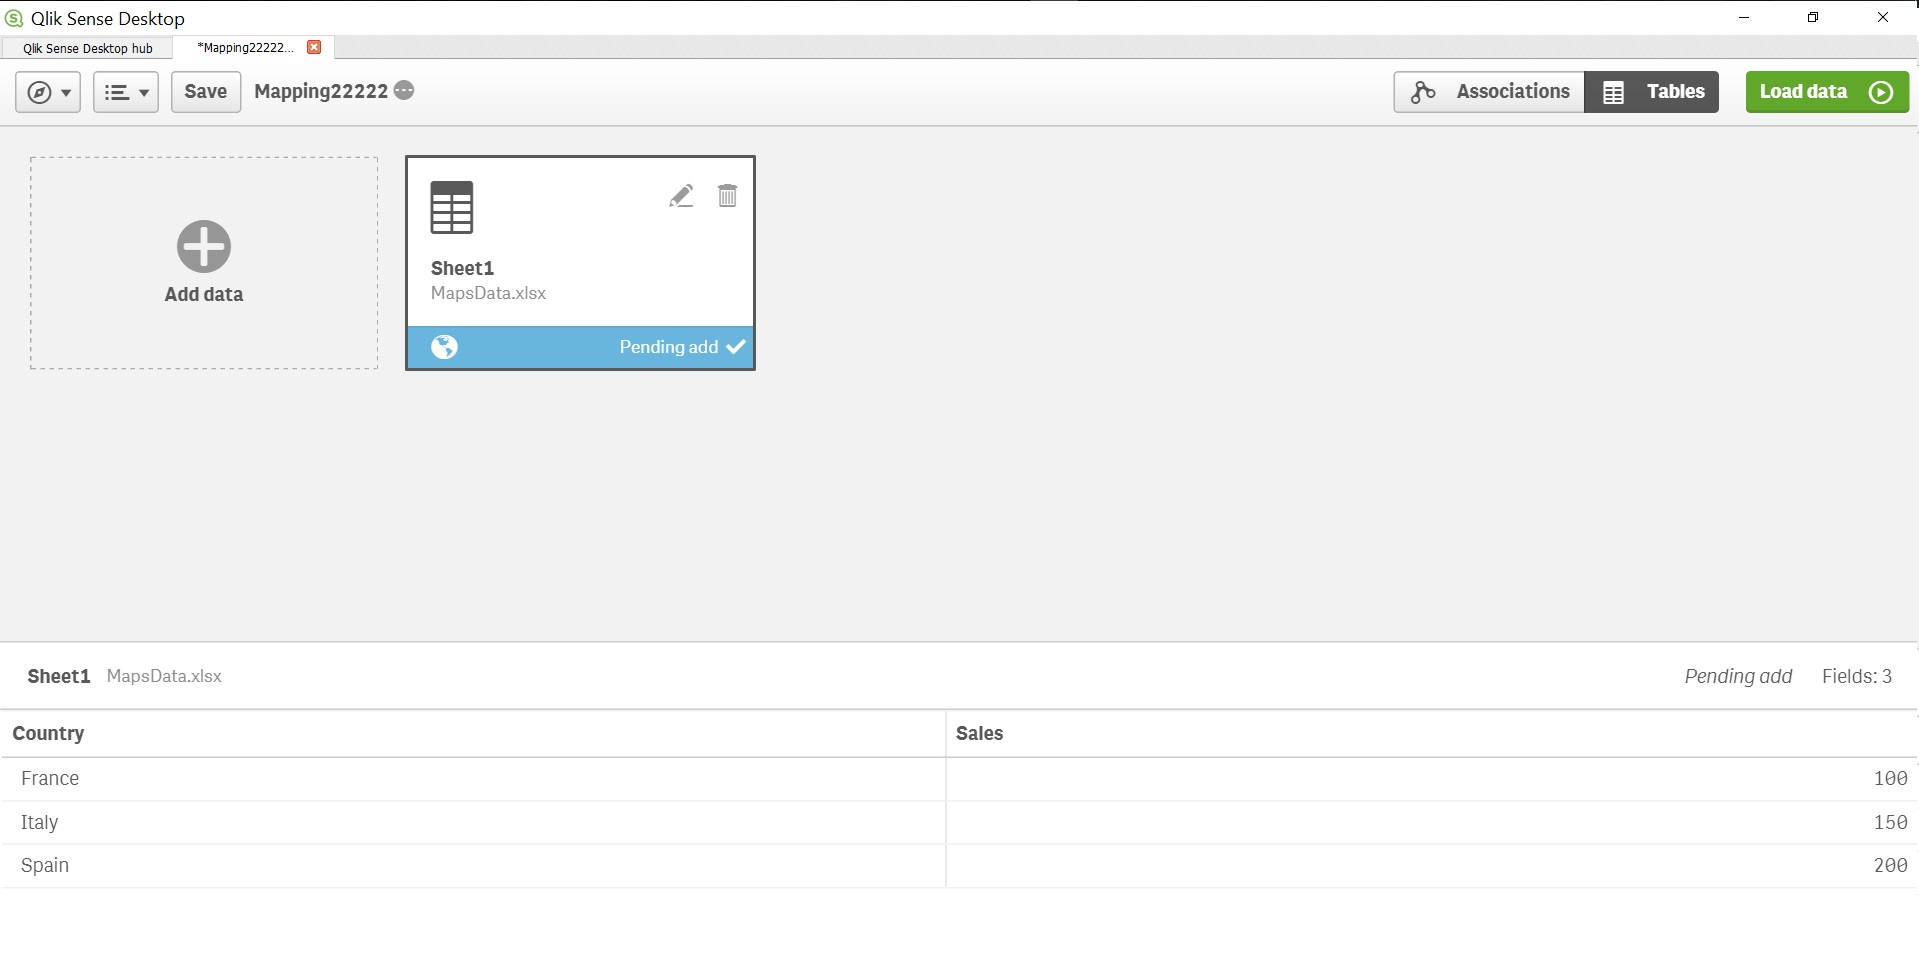
Here you have to click on Prepare data.

You can see the geo icon below Sheet1 icon, and the fact that only two column were loaded Country name and sales.

- Mark as New
- Bookmark
- Subscribe
- Mute
- Subscribe to RSS Feed
- Permalink
- Report Inappropriate Content
Are you trying with data manager or data load editor.
It is working with data manager, i am using version 3.2 SR4.
- Mark as New
- Bookmark
- Subscribe
- Mute
- Subscribe to RSS Feed
- Permalink
- Report Inappropriate Content
figured out, it works only if you click on prepare data.
- Mark as New
- Bookmark
- Subscribe
- Mute
- Subscribe to RSS Feed
- Permalink
- Report Inappropriate Content
I already told you that; you weren't keeping attention ![]()
- Mark as New
- Bookmark
- Subscribe
- Mute
- Subscribe to RSS Feed
- Permalink
- Report Inappropriate Content
Sorry indeed, that time I didn't know that features is exists, because I have loaded data with different methods. plus sometimes I ignore words written in all caps since it seems shouting...
Thank you Omar.
- Mark as New
- Bookmark
- Subscribe
- Mute
- Subscribe to RSS Feed
- Permalink
- Report Inappropriate Content
Another question,
Now Sense did recognize the geo points but 'just' for Shapes not points, I can not use expression like sum sales and get dots in the map chart, just color as expression...
Is it possible to do it somehow?
D