Unlock a world of possibilities! Login now and discover the exclusive benefits awaiting you.
- Qlik Community
- :
- All Forums
- :
- Visualization and Usability
- :
- Re: Qlik Sense - pivot sorting by measures
- Subscribe to RSS Feed
- Mark Topic as New
- Mark Topic as Read
- Float this Topic for Current User
- Bookmark
- Subscribe
- Mute
- Printer Friendly Page
- Mark as New
- Bookmark
- Subscribe
- Mute
- Subscribe to RSS Feed
- Permalink
- Report Inappropriate Content
Qlik Sense - pivot sorting by measures
Hello community!
I am new in Qlik and I alrdy have a lot of questions! But at this moment I got stuck with setting up pivot table. I cannt find how could I sort my pivot table by measures. There is only option to sort it by dimensions. Is there any option to have it sorted by measures?
I use 6 rows and 2 measures and I need to sort it by one measure. It is mandatory for me to analyse data.
I have found a few questions regarding to this, but unanswered or outdated for old version of Qlik. ![]()
Thank you very much!
..DB
- « Previous Replies
-
- 1
- 2
- Next Replies »
- Mark as New
- Bookmark
- Subscribe
- Mute
- Subscribe to RSS Feed
- Permalink
- Report Inappropriate Content
Can you share the sample file or at least share the screen shot of your pivot table and what sorting order you needed?
Thanks.
- Mark as New
- Bookmark
- Subscribe
- Mute
- Subscribe to RSS Feed
- Permalink
- Report Inappropriate Content
You cannot sort a chart by measure.
A chart can be only sorted by dimensions. So if you sort your dimension, it will automatically sort the measure as well.
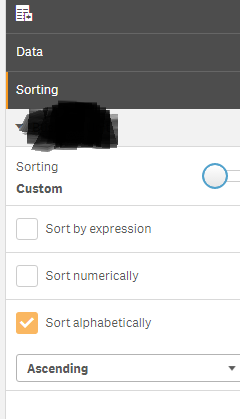
You can sort by expression or numerically or alphabetically as shown below.
Change sorting to 'Custom' and you'll see these options.

- Mark as New
- Bookmark
- Subscribe
- Mute
- Subscribe to RSS Feed
- Permalink
- Report Inappropriate Content
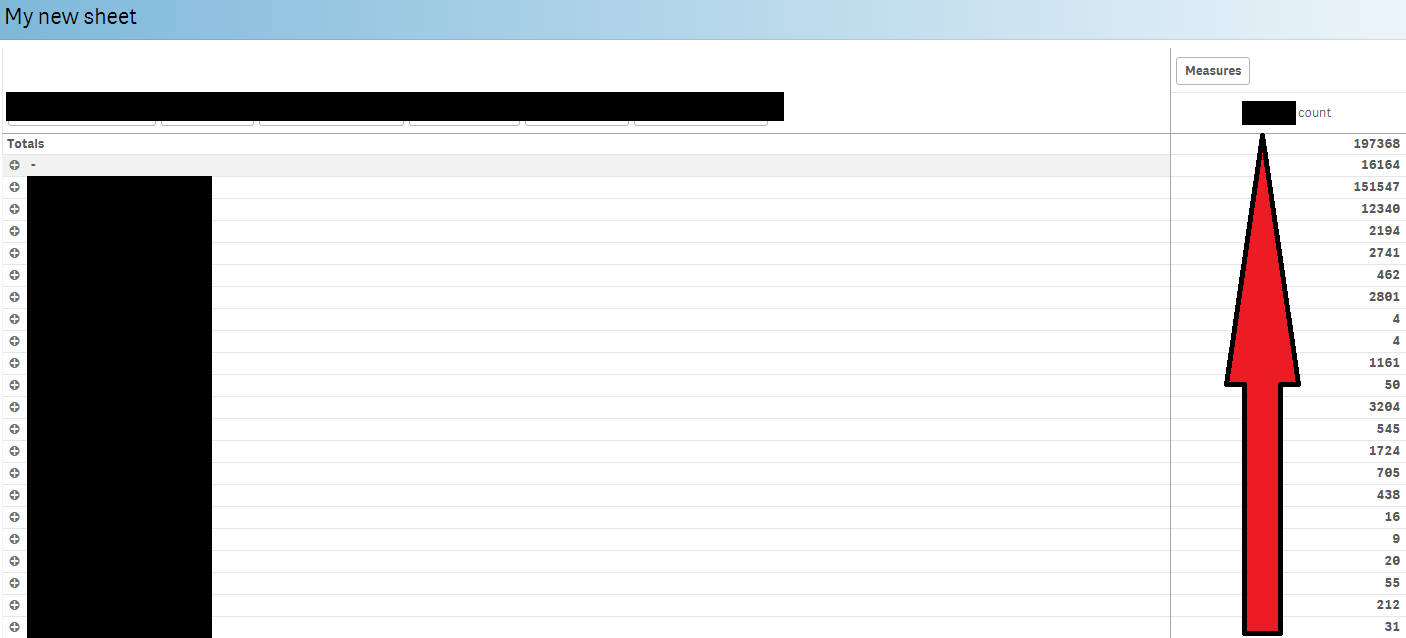
This is how it looks, typical pivot table. I need to sort it by number on the right "by measure". I need these numbers sorted from lowest ot highest. Yea I know that I can sort it by dimension, but it sorts it by "names" in rows, not by numbers on the right. ![]()

- Mark as New
- Bookmark
- Subscribe
- Mute
- Subscribe to RSS Feed
- Permalink
- Report Inappropriate Content
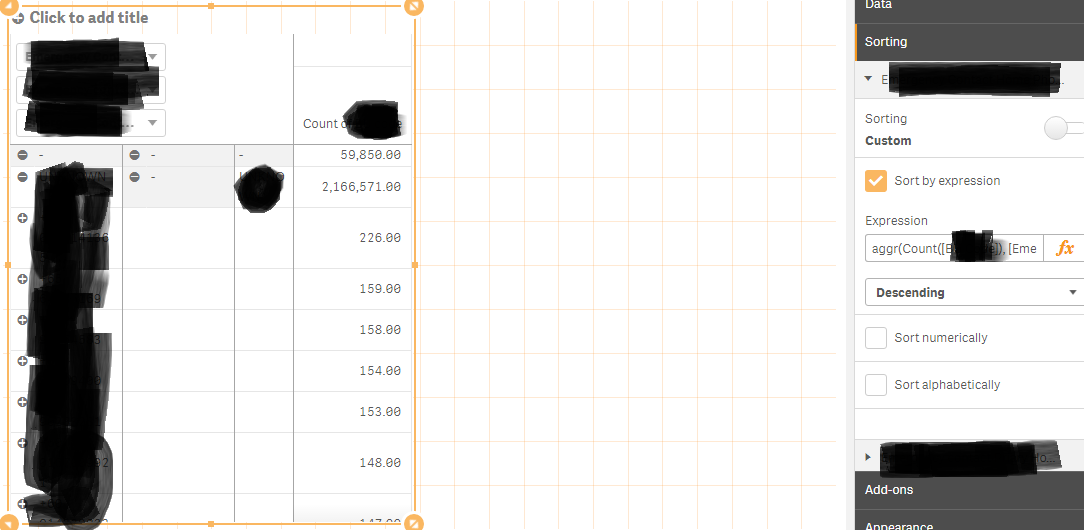
Yes you can do that.
In sorting>Custom>aggr(Count(Your Expression), Your Dimension)>Check Descending

- Mark as New
- Bookmark
- Subscribe
- Mute
- Subscribe to RSS Feed
- Permalink
- Report Inappropriate Content
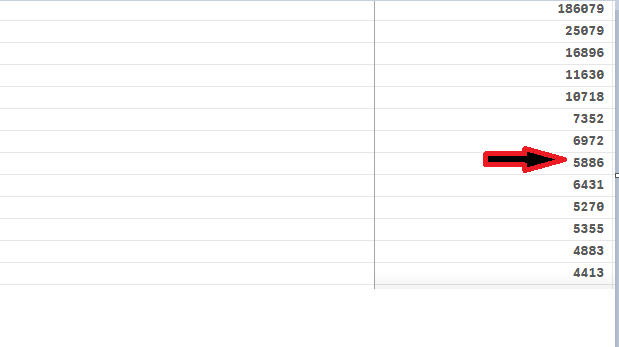
Nice! It helped! Thank you very much! ...Sad is, that it works only sometimes. ![]()
Sort by first dimension is ok. but for the rest it works on 80% only.
For sort I use - "aggr(Count([Name of measuring]), [Current dimension])" and still there is more then one "glitches" ![]()

- Mark as New
- Bookmark
- Subscribe
- Mute
- Subscribe to RSS Feed
- Permalink
- Report Inappropriate Content
Hmmm.. I don't know. It should work fine with no glitches.
You can either use
aggr(Count([Name of measuring]), [Current dimension])
or
aggr(Sum([Name of measuring]), [Current dimension])
and adjust to Descending always.
- Mark as New
- Bookmark
- Subscribe
- Mute
- Subscribe to RSS Feed
- Permalink
- Report Inappropriate Content
It would seem that sorting by measure would be a totally normal thing to do (as with bar charts, where it is available by clicking). Why is this harder in pivot charts?
- Mark as New
- Bookmark
- Subscribe
- Mute
- Subscribe to RSS Feed
- Permalink
- Report Inappropriate Content
I have the same problem I tried all kind of weird aggr and dual formula I read in other post in the forum but without any success.
Very frustrating that such a basic capability is not available. Probably it works with one measure but if you have more measure it no longer works
- Mark as New
- Bookmark
- Subscribe
- Mute
- Subscribe to RSS Feed
- Permalink
- Report Inappropriate Content
Tried this, but cannot get it to work with more columns.
I have "CustomerNames" as rows, "Years" as columns and "Revenue" as measures.
In this case I have multiple Years (columns) and want users to be able to sort on Revenue easily.
Is there another way?
Very basic feature for a pivot table. Really odd that this is not out of the box included tbh!
- « Previous Replies
-
- 1
- 2
- Next Replies »