Unlock a world of possibilities! Login now and discover the exclusive benefits awaiting you.
- Qlik Community
- :
- Forums
- :
- Analytics
- :
- New to Qlik Analytics
- :
- Re: Question on filtering when {1} is used
- Subscribe to RSS Feed
- Mark Topic as New
- Mark Topic as Read
- Float this Topic for Current User
- Bookmark
- Subscribe
- Mute
- Printer Friendly Page
- Mark as New
- Bookmark
- Subscribe
- Mute
- Subscribe to RSS Feed
- Permalink
- Report Inappropriate Content
Question on filtering when {1} is used
I have a table that looks like this:
| Employee | Sum({1} Sales) |
|---|---|
| A | 3 |
| B | 3 |
| C | 4 |
If I select 'A', then the table will remain unchanged as the use of {1} overrides my selection. But if I add the "total" keyword to the measure, then a selection of A gives me this filtered table containing only one row:
| Employee | Sum({1} total Sales) |
|---|---|
| A | 10 |
How come the filter is applied to the second table, but not the first? And if I add both measures to the same table, then I get this result that is also insensitive to selections (all rows are shown no matter what I select).
| Employee | Sum({1} Sales) | Sum({1} total Sales) |
|---|---|---|
| A | 3 | 10 |
| B | 3 | 10 |
| C | 4 | 10 |
What are the rules that guide when a certain row is present in a table when such set modifiers are used?
- Tags:
- set modfiers
- Mark as New
- Bookmark
- Subscribe
- Mute
- Subscribe to RSS Feed
- Permalink
- Report Inappropriate Content
Seems like a bug to me.
- Mark as New
- Bookmark
- Subscribe
- Mute
- Subscribe to RSS Feed
- Permalink
- Report Inappropriate Content
The total is not a part of the set analysis and therefore it reacts on the selection. But you could add the dimensions which you need within the total like: ... TOTAL <Employee> ... What is the background of your question?
- Marcus
- Mark as New
- Bookmark
- Subscribe
- Mute
- Subscribe to RSS Feed
- Permalink
- Report Inappropriate Content
Marcus -
From what I understand the issue is that the expression is Sum({1} TOTAL Sales) and when selecting a single Employee (A), it is showing
Employee Sum({1} TOTAL Sales)
A 10
instead of
Employee Sum({1} TOTAL Sales)
A 10
B 10
C 10
- Mark as New
- Bookmark
- Subscribe
- Mute
- Subscribe to RSS Feed
- Permalink
- Report Inappropriate Content
I'm not sure if I really understand the documentation about the behaviour of TOTAL as addition to a set analysis and if it worked like expected or if it is buggy in any way. But I think there will be any way around of it to create the needed view - for example if there is any further expression within the table which might enforce the displaying of all dimension-values or maybe an aggr() is used around the expression or ...
- Marcus
- Mark as New
- Bookmark
- Subscribe
- Mute
- Subscribe to RSS Feed
- Permalink
- Report Inappropriate Content
The background is that I was actually quite surprised that my selections had no effect on the number of rows shown in the first table. And then I got even more confused when I noticed that when I added that "total" keyword, then the filters suddenly took effect again. So now I guess there are three things I find confusing:
- The first table can not be filter.
- The second table can be filtered.
- The filtering behavior of the first and second tables are not the same.
I guess I was hoping for someone to point me to a place where I could find a definition of what to expect and when. I found this page that touches on the subject and that has examples that are very similar to the ones I posted above, but it doesn't really discuss the filtering behavior:
Personally I find it odd that the definition of a measure can ever have any effect on the set of dimensions to show. My original expectation was simply that the expressions would be evaluated based on the available set of dimensions, and that any adjustments to that set would have to be defined as part of the dimensions.
- Mark as New
- Bookmark
- Subscribe
- Mute
- Subscribe to RSS Feed
- Permalink
- Report Inappropriate Content
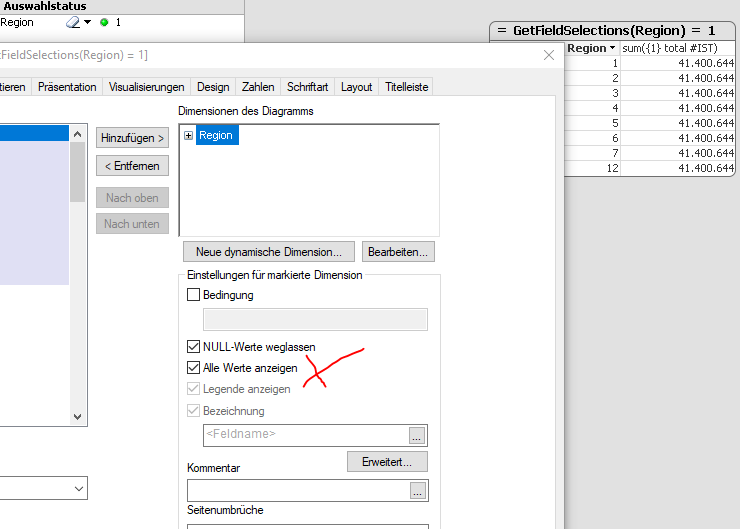
I think the difference between the filter on table 1 and 2 is the dimension-option within the chart to display all values - if you enable it the table 2 will show all values even by any selection on the dimension-values, see:

This option (default is disabled) also like the NULL hiding option (default is enabled) within the tab presentation will impact how a calculation is made respectively how the results are displayed.
- Marcus
- Mark as New
- Bookmark
- Subscribe
- Mute
- Subscribe to RSS Feed
- Permalink
- Report Inappropriate Content
Interesting! I didn't know about that setting, so thanks for pointing it out to me. Unfortunately I don't think it's available in Qlik Sense.
- Mark as New
- Bookmark
- Subscribe
- Mute
- Subscribe to RSS Feed
- Permalink
- Report Inappropriate Content
Maybe it's implemented in any extension. I could imagine that it may included in tables from Vizlib | Qlik Sense Extension Library.
- Marcus