Unlock a world of possibilities! Login now and discover the exclusive benefits awaiting you.
- Qlik Community
- :
- All Forums
- :
- Visualization and Usability
- :
- Rolling Sum Of 12 Month
- Subscribe to RSS Feed
- Mark Topic as New
- Mark Topic as Read
- Float this Topic for Current User
- Bookmark
- Subscribe
- Mute
- Printer Friendly Page
- Mark as New
- Bookmark
- Subscribe
- Mute
- Subscribe to RSS Feed
- Permalink
- Report Inappropriate Content
Rolling Sum Of 12 Month
HI
I need to make line chart where on x axis would be months and day of today like if today is 17 april it would be , 17apr ,17mar ,17feb and on Y axis Would be Sum of amounts.
From every date There Should be sum of last 12 month, like if it is 17 april, on chart this point should Show sum of amount from 16/04/2017 to 17/04/20178 and so on for every date on line Chart.
- « Previous Replies
-
- 1
- 2
- Next Replies »
- Mark as New
- Bookmark
- Subscribe
- Mute
- Subscribe to RSS Feed
- Permalink
- Report Inappropriate Content
Maybe
=Rangesum(Above(expression,12))
- Mark as New
- Bookmark
- Subscribe
- Mute
- Subscribe to RSS Feed
- Permalink
- Report Inappropriate Content
As I Understand this formula show Cumulative sum but in case when select 15/05/2017 this date it should show sum between 14/05/2016 - 15/05/2017.
- Mark as New
- Bookmark
- Subscribe
- Mute
- Subscribe to RSS Feed
- Permalink
- Report Inappropriate Content
Hi,
for rolling 12 months on every date, try this:
RangeSum(above(total sum(Measure_field),0,12))
PS: Sum is an example..
- Mark as New
- Bookmark
- Subscribe
- Mute
- Subscribe to RSS Feed
- Permalink
- Report Inappropriate Content
Following article may help
Calculating rolling n-period totals, averages or other aggregations
- Mark as New
- Bookmark
- Subscribe
- Mute
- Subscribe to RSS Feed
- Permalink
- Report Inappropriate Content
I calculates what I want.But it shows me this
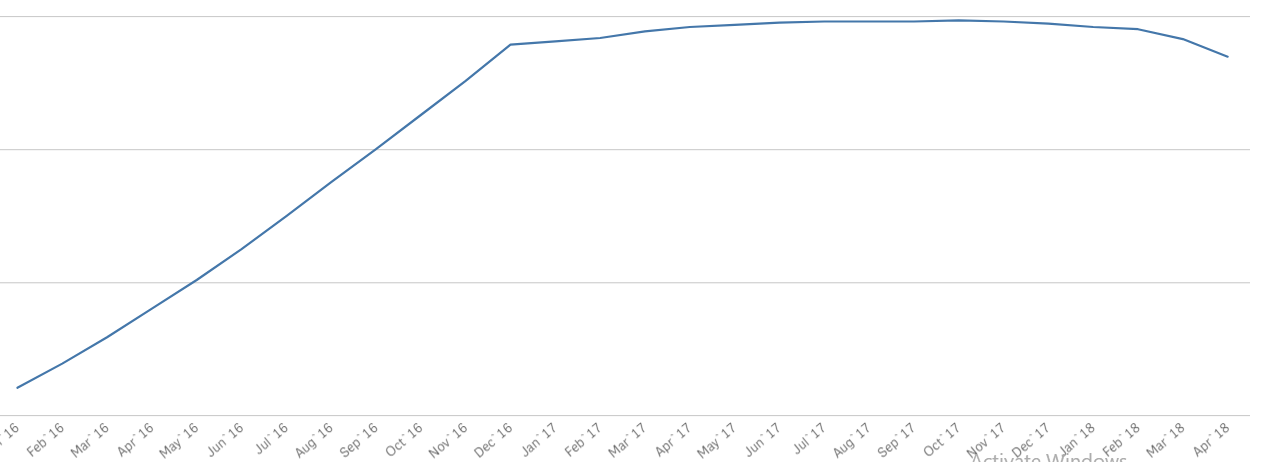
As we see before December 2016 it can't calculate because the information that we have is from Jan 16 . This line chart shows all months that we have but I want to show only the last 12 month. From Apr 17 to Apr 18 . Dimension that I use is =[Year Month]
- Mark as New
- Bookmark
- Subscribe
- Mute
- Subscribe to RSS Feed
- Permalink
- Report Inappropriate Content
we need to add extra code as a set analysis to limit it to the last 12 months, it is possible.
what is the name of the dimension used and what is it's format ?
- Mark as New
- Bookmark
- Subscribe
- Mute
- Subscribe to RSS Feed
- Permalink
- Report Inappropriate Content
Dimension that I use is =[Year Month]
In the script I have written this ---- month(%lnk_date) & '`' & right(year(%lnk_date),2) as [Year Month]
- Mark as New
- Bookmark
- Subscribe
- Mute
- Subscribe to RSS Feed
- Permalink
- Report Inappropriate Content
Hi,
Would it possible for you to share masked data and app. It would help to help you.
Also what I'm observing in your chart screen shot is that you are showing Month Year (it is not date, I understand you want to display past 12 months particular day information based on today's date).
BR,
Vijay
- Mark as New
- Bookmark
- Subscribe
- Mute
- Subscribe to RSS Feed
- Permalink
- Report Inappropriate Content
Thanks for helping me, but sorry, I can't
Yes, I want to display past 12 months particular day information based on today's date but I also want to have a drill-down on them that show me the dates
- « Previous Replies
-
- 1
- 2
- Next Replies »