Unlock a world of possibilities! Login now and discover the exclusive benefits awaiting you.
- Qlik Community
- :
- All Forums
- :
- Visualization and Usability
- :
- Re: How can we import Images in SVG Reader??
- Subscribe to RSS Feed
- Mark Topic as New
- Mark Topic as Read
- Float this Topic for Current User
- Bookmark
- Subscribe
- Mute
- Printer Friendly Page
- Mark as New
- Bookmark
- Subscribe
- Mute
- Subscribe to RSS Feed
- Permalink
- Report Inappropriate Content
SVG READER
Hi All,
I have installed SVG reader Extension in my Qliksense Server. I have create a Human Body Image through Inkspace.
Can anyone help me how can I import this image to the SVG reader?
Thanks
Juna
- Mark as New
- Bookmark
- Subscribe
- Mute
- Subscribe to RSS Feed
- Permalink
- Report Inappropriate Content
Hi Aehman,
Did you get chance to look at the Visualization? The only part remaining is the bubble size is not increasing or decreasing with the value of the measure. I added third Measure as the sum of Idx and Idy and still it does not work.
If you could help me
Thanks
Juna
- Mark as New
- Bookmark
- Subscribe
- Mute
- Subscribe to RSS Feed
- Permalink
- Report Inappropriate Content
Not yet, I'll try and see if I could be of any more help.
- Mark as New
- Bookmark
- Subscribe
- Mute
- Subscribe to RSS Feed
- Permalink
- Report Inappropriate Content
There is no field as such IdAccidents in the XL file.
How do you plan to bring that up?
Or do you have any measure which I can use to change the color of dots?
Bubble Size would be constant as there is no way you can define the dynamic bubble size.
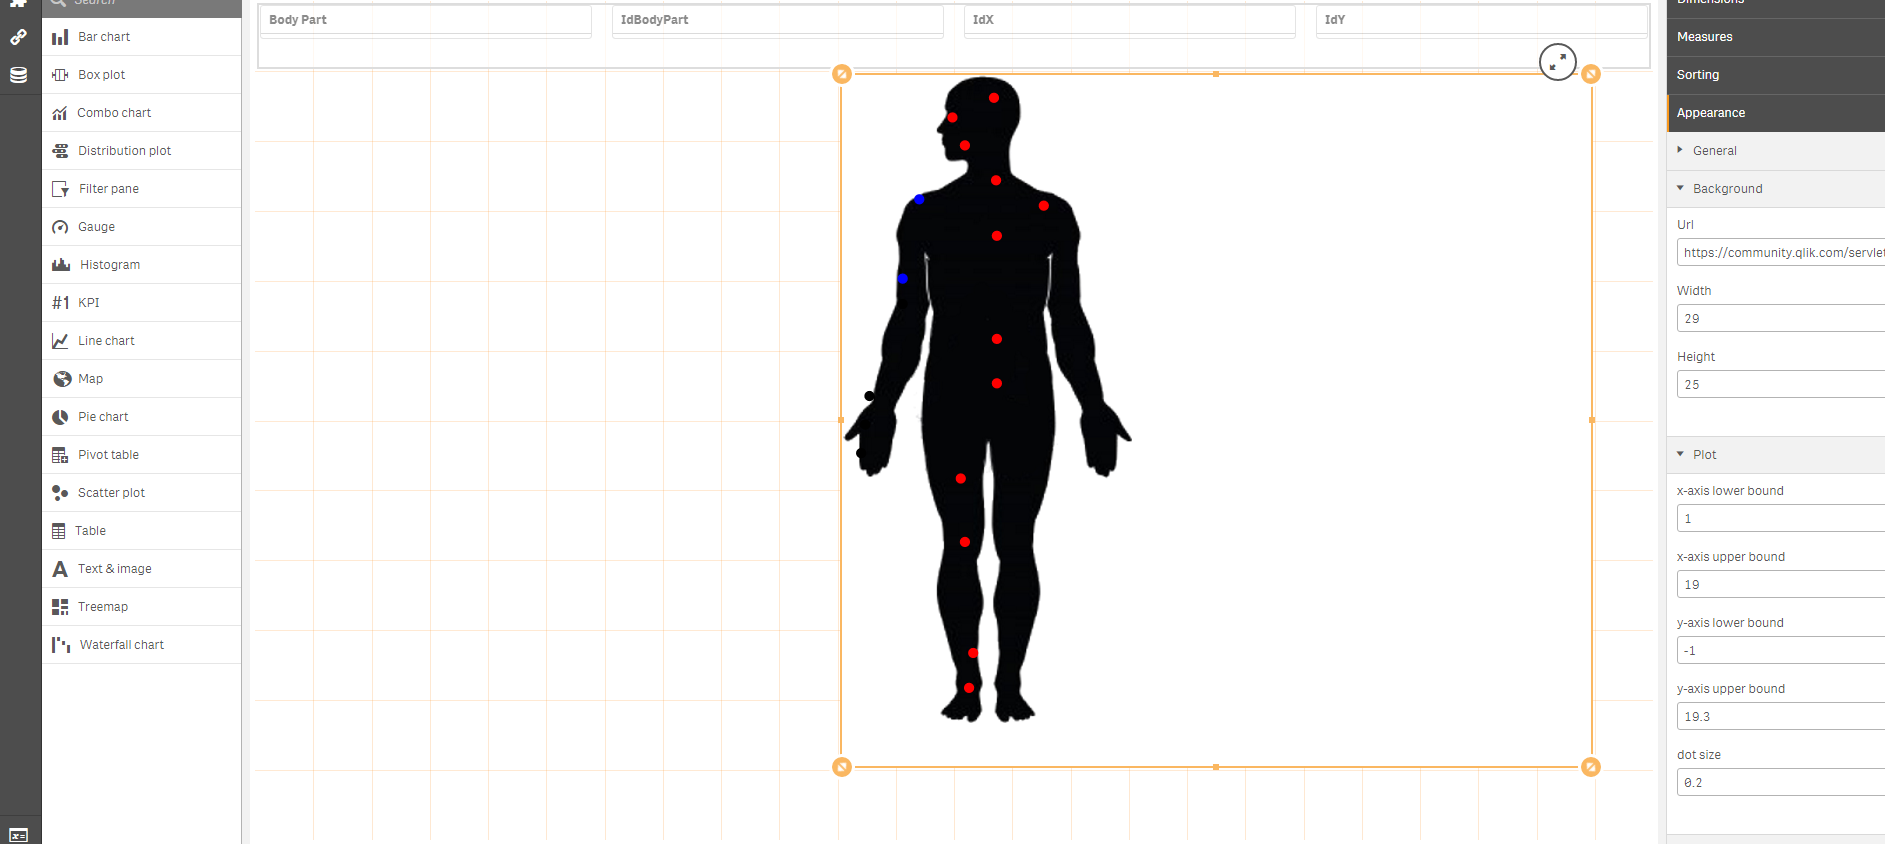
This is what I could achieve, the points has been plotted correctly on body parts but we do not have any count(accidents)
I just gave an expression as
if(sum(IdX)>3, '#f00', if(sum(IdY)>13, '#00f'))
You'd have to use HEX color code not RGB to color the bubbles.

- Mark as New
- Bookmark
- Subscribe
- Mute
- Subscribe to RSS Feed
- Permalink
- Report Inappropriate Content
I opened the QVW file that Isou created and took data from there.
- Mark as New
- Bookmark
- Subscribe
- Mute
- Subscribe to RSS Feed
- Permalink
- Report Inappropriate Content
Do I need to write this expression in script?
if(sum(IdX)>3, '#f00', if(sum(IdY)>13, '#00f'))
- Mark as New
- Bookmark
- Subscribe
- Mute
- Subscribe to RSS Feed
- Permalink
- Report Inappropriate Content
No, write it as a measure.
- Mark as New
- Bookmark
- Subscribe
- Mute
- Subscribe to RSS Feed
- Permalink
- Report Inappropriate Content
I am able to change the color now but in Scattered plot third measure is always for the bubble size. I added sum(accidents) as the measure to dynamically change the bubble size still the bubble size does not change with the value change in measure.
- Mark as New
- Bookmark
- Subscribe
- Mute
- Subscribe to RSS Feed
- Permalink
- Report Inappropriate Content
the Third measure in this extension is only for Color Coding
and the dot size option is in Plot settings.
I'm not sure if you'd have to edit the Java Script to get what you want...
- Mark as New
- Bookmark
- Subscribe
- Mute
- Subscribe to RSS Feed
- Permalink
- Report Inappropriate Content
Thank you.
- Mark as New
- Bookmark
- Subscribe
- Mute
- Subscribe to RSS Feed
- Permalink
- Report Inappropriate Content
Hello,
For your information, in April 2019, you can use a svg in background image for maps. it works just fine 🙂