Unlock a world of possibilities! Login now and discover the exclusive benefits awaiting you.
- Qlik Community
- :
- All Forums
- :
- Visualization and Usability
- :
- Re: Selecting 200 entries from a bar chart to make...
- Subscribe to RSS Feed
- Mark Topic as New
- Mark Topic as Read
- Float this Topic for Current User
- Bookmark
- Subscribe
- Mute
- Printer Friendly Page
- Mark as New
- Bookmark
- Subscribe
- Mute
- Subscribe to RSS Feed
- Permalink
- Report Inappropriate Content
Selecting 200 entries from a bar chart to make a filter
Hello all! Beginner question here!
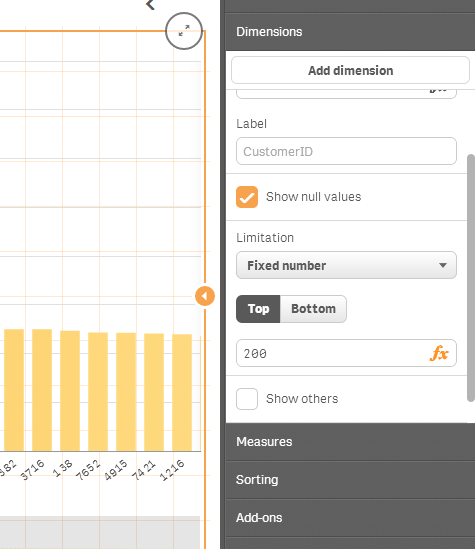
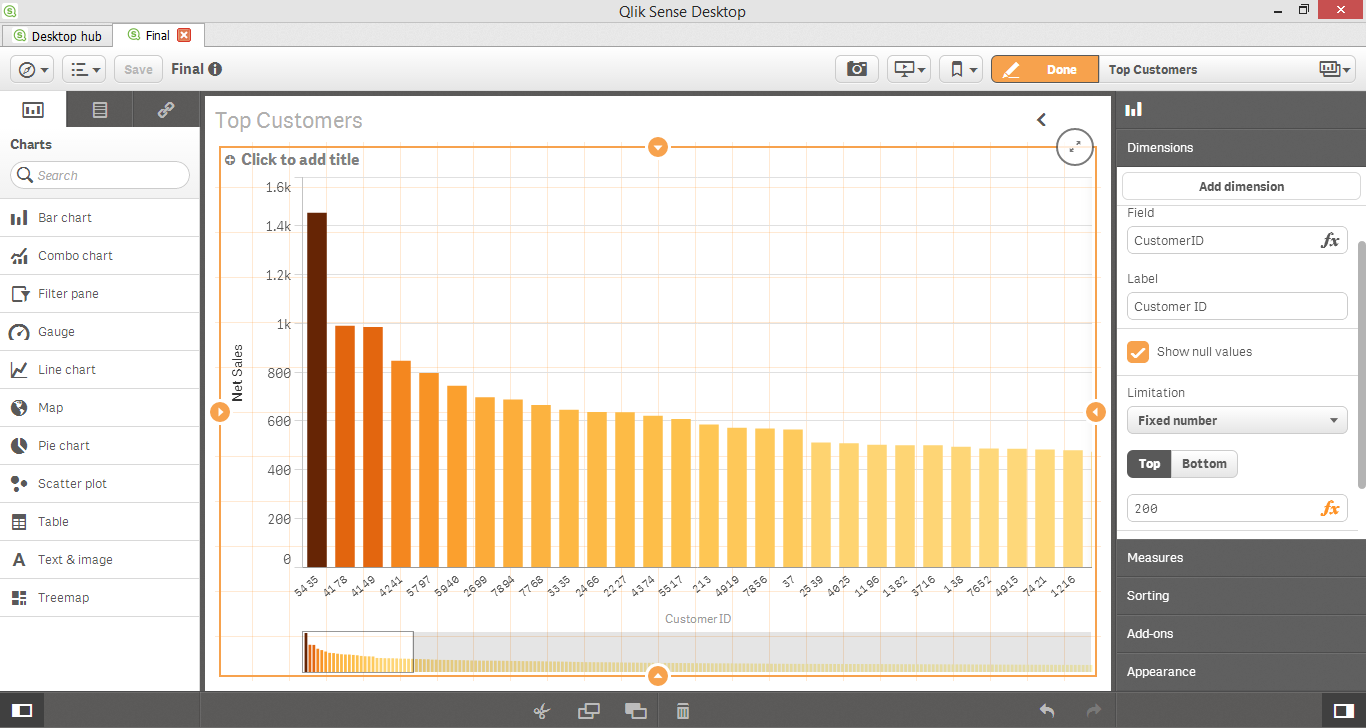
I have created a bar chart of customer IDs (X axis) vs net sales (Y axis) and I wanted to select the top 200 customers. So from the side tab made the necessary change in the limitation setting and chose 200. 
Now, my data has other properties like, zip code of the customer, mode of purchase etc. So what I want to do, is select these top 200 customers and make a filter out of that. So that I can analyse my data solely on the basis of the selected individuals.
Like for example say, I want to make a pie chart of the mode of order (as dimension) and net sales (sum net sales as measure) with the filter allowing me to display the relevant graphic on the top 200 customers and not all the the customers I have in the data set.
Any help would be amazing!
Thanks in advance!
Regards
Arka
- « Previous Replies
- Next Replies »
Accepted Solutions
- Mark as New
- Bookmark
- Subscribe
- Mute
- Subscribe to RSS Feed
- Permalink
- Report Inappropriate Content
Hi , i think some of the answers pertained to QlikView , not Qlik Sense, but its clear that from your screenshots this is for Qlik Sense.
You can apply virtually any independant filter on any chart by using SET ANALYSIS.
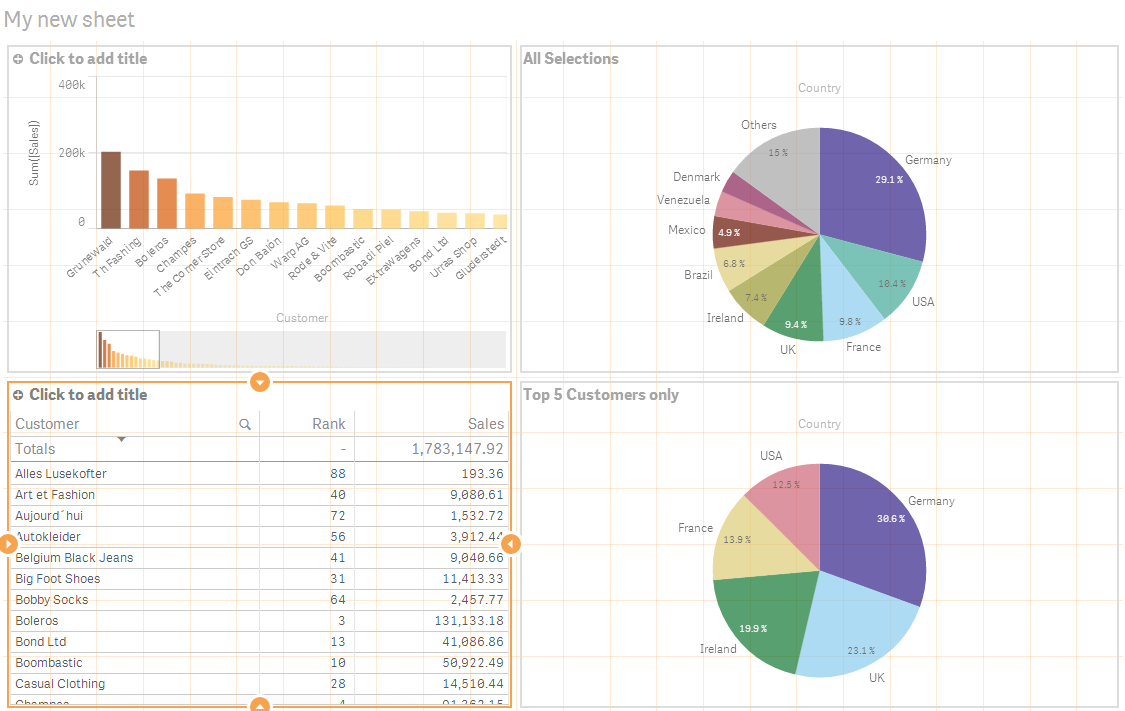
In the following example, I'm showing sum(Sales) by Customer on the left and by Country on the right.
I've used the RANK() function to grab the sales ranking of each customer in the bottom left. The expression looks like this:
rank( total sum(Sales))
Now when i want to use a filter based on the rank within another chart, I do that by filtering customer within a SET Statement.
In the bottom right PIE i changed sum(Sales) as the measure expression to the following.
=Sum( {$<Customer={"=rank( total sum(Sales))<=5"}>} [Sales])
In this situation, the chart will update based on ANY selection EXCEPT for the Customer field because its been hard defined via the SET STATEMENT to only bring back the customers whose sales are in the top 5.
This is very flexible syntax.

- Mark as New
- Bookmark
- Subscribe
- Mute
- Subscribe to RSS Feed
- Permalink
- Report Inappropriate Content
go for pivot or stright
in bar u cant see clearly
- Mark as New
- Bookmark
- Subscribe
- Mute
- Subscribe to RSS Feed
- Permalink
- Report Inappropriate Content
in the chart properties->dimension limits, you can pick the largest (money or quantity) 20 values.
- Mark as New
- Bookmark
- Subscribe
- Mute
- Subscribe to RSS Feed
- Permalink
- Report Inappropriate Content
if u want see top 10 or 20 u can go with dimension limits but when u go for 200 sales u cant see clearly
- Mark as New
- Bookmark
- Subscribe
- Mute
- Subscribe to RSS Feed
- Permalink
- Report Inappropriate Content
I fear I have not made myself clear.
I need to limit to be 200 top customers.
I want to then select those top 200 so that I can use them as a filter.
- Mark as New
- Bookmark
- Subscribe
- Mute
- Subscribe to RSS Feed
- Permalink
- Report Inappropriate Content
Hi
as alex given direction to dimension limits properties->dimension limits> select top 200(there will be option )
- Mark as New
- Bookmark
- Subscribe
- Mute
- Subscribe to RSS Feed
- Permalink
- Report Inappropriate Content
Hi,
=aggr(sum(if(rank(Customer)<=200,Custom),Sales))
something like this. Not sure if it is Ok not tested!
Regards
André Gomes
- Mark as New
- Bookmark
- Subscribe
- Mute
- Subscribe to RSS Feed
- Permalink
- Report Inappropriate Content
I am sorry. But I'm unable to find the option which you are referring. I have a feeling that what you are pointing at is right in front of me but unfortunately I can't seem to find it.

I am terribly sorry if I am being obtuse.
What I want to do is make a filter which will have the above 200 customers selected. So that I can analyse their trends.
Regards
Arka
- Mark as New
- Bookmark
- Subscribe
- Mute
- Subscribe to RSS Feed
- Permalink
- Report Inappropriate Content
Hi
i think ur opening in accespoint ?
or u dont have chance to access properties of that bar chart?
whether ur using qlik sense?
in access point u cant change
let me know for above answers for my questions
- Mark as New
- Bookmark
- Subscribe
- Mute
- Subscribe to RSS Feed
- Permalink
- Report Inappropriate Content
right click on the chart >if u find properties option>then click on it>there will be a tab dimension limits >click on first radio buttion for top and enter 200( in qlikview)
but i am not sure about how qlik sense looks
- « Previous Replies
- Next Replies »